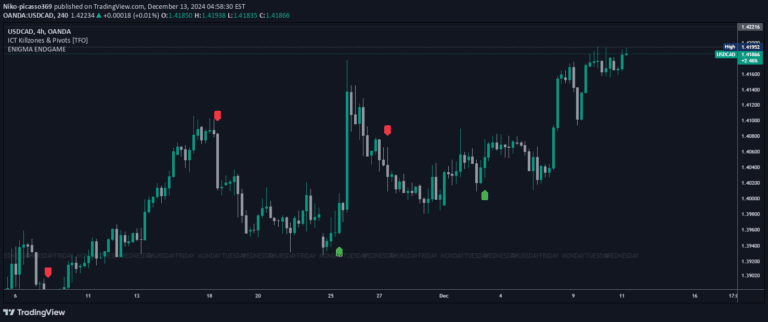
PSP is a technical analysis tool comparing price action across three tickers to identify market desynchronization and potential trading opportunities based on price structure divergences.
Explore complementary indicator rolesHow it works
The Precision Swing Point (PSP) indicator analyzes the price structure of three different market tickers simultaneously, looking for moments of divergence. It identifies instances where candle colors and wicks differ across the selected markets, plotting an arrow to signal potential trading opportunities.
Traders customize the indicator by selecting specific tickers, setting a lookback period, and highlighting key trading times. When a divergence occurs, the indicator helps traders pinpoint exact entry points by focusing on moments where one ticker takes a wick while others do not.
Why it may be useful
PSP provides traders with a unique perspective on market synchronization, revealing hidden trading opportunities that might be missed by traditional analysis methods. By comparing multiple markets simultaneously, traders can gain insights into relative market strength and potential price movements.
The indicator helps minimize risk by offering precise entry and stop-loss points, allowing traders to make more informed decisions. Its ability to highlight market desynchronization gives traders an edge in identifying potential trade setups across different market indices.
When to explore it
PSP works best during periods of market volatility when different indices or assets show varying price behaviors. It is particularly effective for traders monitoring multiple markets simultaneously, such as index futures or cryptocurrency markets.
The indicator is most useful during active trading hours, especially around market opens or during significant news events. Traders can customize the lookback period and highlighted times to align with their specific trading strategy and market focus.
Keep exploring
What we’ve verified
Access, alerts and repainting behaviour have not been independently verified for this indicator. Check the creator’s current publication and settings.
General descriptions and classifications are recovered research. Verified details above identify the specific checks we have completed. Check the creator’s current publication for later changes.