
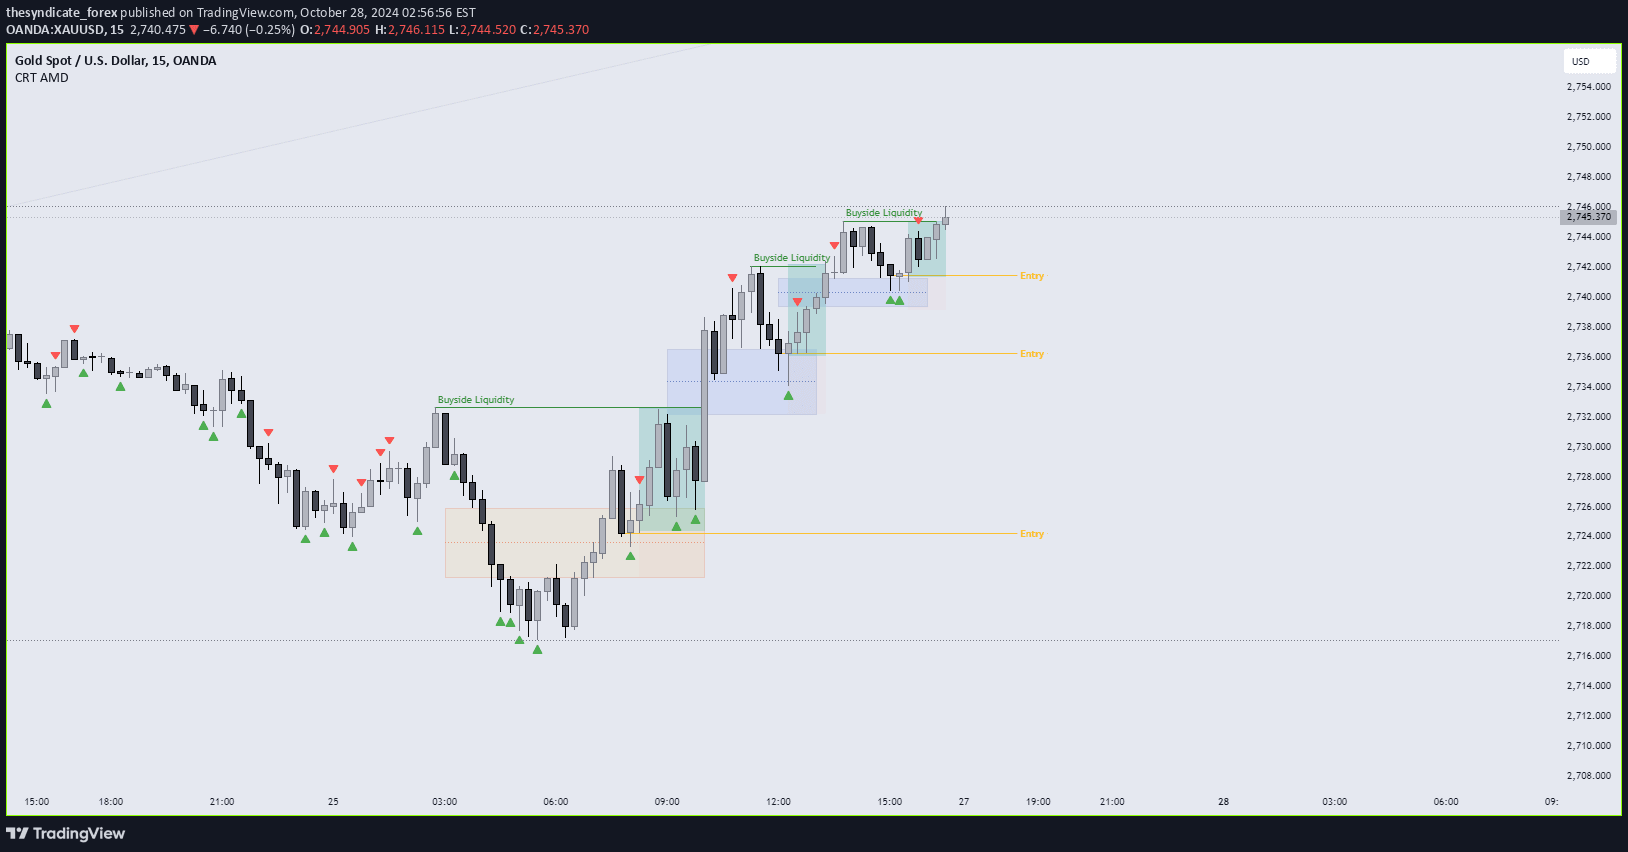
A power cycle indicator identifying potential market manipulations or reversals by tracking candle sweeps and range closures, designed to highlight strategic entry points.
Explore complementary indicator rolesHow it works
The Power of Three Cycle indicator focuses on analyzing consecutive candle relationships to detect potential market manipulations. It specifically looks for candles that sweep either the high or low of the previous candle and then close back within that previous candle's range, signaling a possible reversal or manipulation point.
By marking these specific candle interactions, the indicator helps traders identify moments where market dynamics might be shifting. The methodology relies on precise candle pattern recognition, tracking how price movements interact with previous candle boundaries to suggest potential trend changes or strategic entry opportunities.
Why it may be useful
This indicator provides traders with a nuanced method of understanding potential market manipulations and trend reversals beyond traditional technical analysis. By highlighting specific candle interactions, it offers insights into subtle price movements that might indicate underlying market sentiment shifts.
The power of this approach lies in its ability to detect complex market dynamics that simpler indicators might miss. Traders can use these signals to anticipate potential trend changes, manage risk more effectively, and make more informed trading decisions based on sophisticated pattern recognition.
When to explore it
The Power of Three Cycle indicator works best in markets with clear directional movements and where price action demonstrates consistent pattern behaviors. It is particularly effective when combined with higher timeframe analysis and lower timeframe entry setups, which can significantly enhance its predictive accuracy.
Traders should consider using this indicator in markets with sufficient liquidity and volatility, such as major forex pairs, stock indices, and actively traded commodities. Its effectiveness increases when traders corroborate its signals with additional technical and fundamental analysis methods.
Keep exploring
What we’ve verified
Access, alerts and repainting behaviour have not been independently verified for this indicator. Check the creator’s current publication and settings.
General descriptions and classifications are recovered research. Verified details above identify the specific checks we have completed. Check the creator’s current publication for later changes.


