A trading indicator that detects potential market tops and bottoms by counting consecutive candles based on price comparison and predefined criteria across multiple timeframes.
Explore complementary indicator rolesHow it works
The indicator analyzes price action by comparing the current candle's close price with a candle from X periods in the past. For bullish signals, it increments a count when the current candle's price is higher than the past candle's price, and for bearish signals, it does the opposite when the current price is lower.
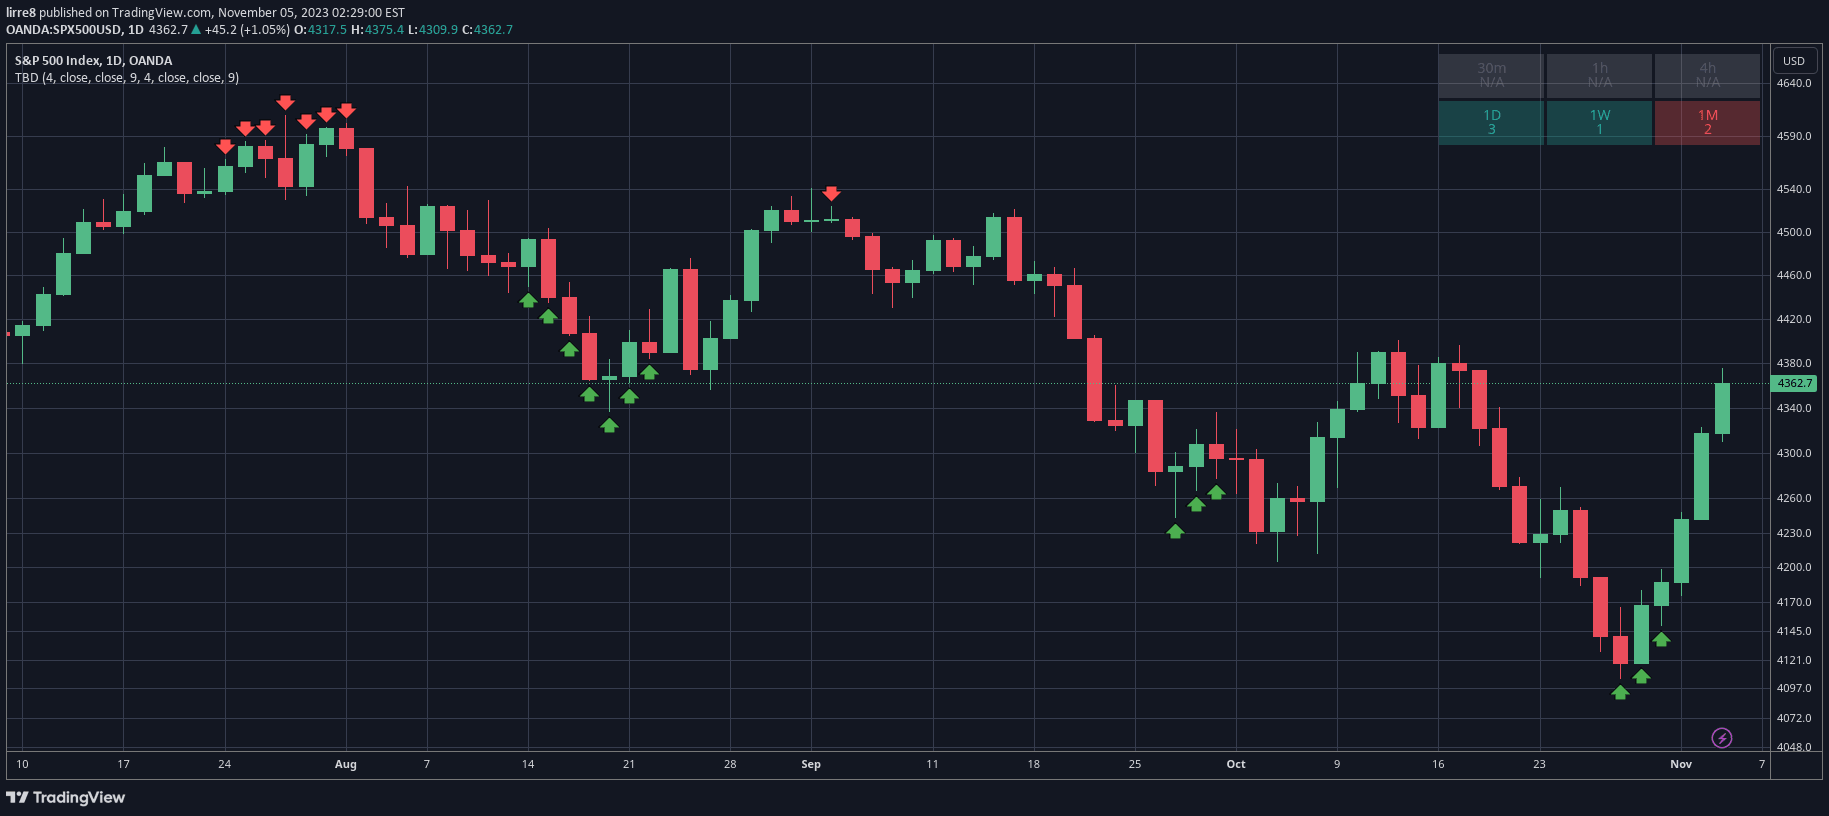
The count continues for consecutive candles meeting these criteria, with a maximum threshold that determines when a top or bottom is detected. When the count reaches this maximum, the indicator plots a visual marker on the chart - a red arrow for tops and a green arrow for bottoms, signaling potential trend reversals or significant price points.
Why it may be useful
This indicator provides traders with a systematic approach to identifying potential trend reversals and key market turning points. By quantifying price action across different timeframes, it offers a structured method to recognize market momentum shifts that might not be immediately apparent through visual inspection.
The multi-timeframe visualization enhances traders' understanding by displaying count information across various time horizons, allowing for a more comprehensive market analysis. This approach helps traders make more informed decisions by providing objective criteria for detecting potential tops and bottoms.
When to explore it
The indicator is most effective in markets with clear trending characteristics, where price movements show consistent directional momentum. It works best when applied to liquid markets with sufficient price volatility, such as major forex pairs, stock indices, and prominent commodities.
Traders should use this signal in conjunction with other technical analysis tools to confirm potential entry and exit points. It is particularly useful for identifying potential trend reversals, supporting traders in making more strategic decisions about market entry and exit timing.
Keep exploring
What we’ve verified
Access, alerts and repainting behaviour have not been independently verified for this indicator. Check the creator’s current publication and settings.
General descriptions and classifications are recovered research. Verified details above identify the specific checks we have completed. Check the creator’s current publication for later changes.