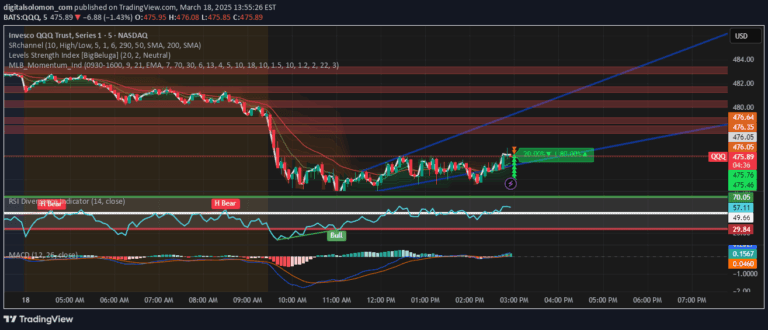
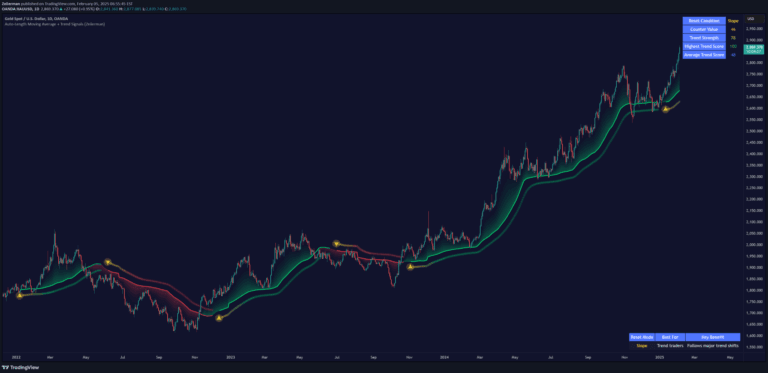
The GMMA Momentum Indicator uses 12 exponential moving averages to analyze market trends, momentum, and potential trading signals by comparing short-term and long-term trader sentiments.
Explore complementary indicator rolesHow it works
The GMMA Momentum Indicator employs 12 exponential moving averages (EMAs) divided into two groups: six short-term EMAs and six long-term EMAs. The short-term EMAs represent trader sentiment and momentum, while the long-term EMAs reflect broader market trends and investor behavior.
By analyzing the interaction and positioning of these EMA groups, traders can identify trend strength, momentum, and potential market reversals. The indicator provides visual cues through background colors, with green indicating bullish trends, red signaling bearish trends, and yellow triangles highlighting potential compression or breakout scenarios.
Why it may be useful
The GMMA Momentum Indicator offers traders a comprehensive view of market dynamics by simultaneously tracking short-term and long-term momentum. It helps traders understand the underlying market sentiment and potential trend shifts by visualizing the relationship between different timeframe perspectives.
By providing clear visual signals and highlighting trend strength, the indicator enables traders to make more informed decisions about market entry and exit points. Its ability to detect trend changes, momentum shifts, and potential compression zones makes it a valuable tool for understanding complex market movements.
When to explore it
The GMMA Momentum Indicator is most effective on daily or 4-hour charts for swing trading and day trading strategies. It works best in markets with clear trending behavior, where the interaction between short-term and long-term moving averages provides meaningful insights into market momentum.
Traders should use this indicator in conjunction with other technical analysis tools to confirm signals and reduce false positives. It is particularly useful when analyzing markets with sufficient liquidity and during periods of consistent price movement, such as in major currency pairs, stock indices, and actively traded commodities.
Keep exploring
What we’ve verified
Access, alerts and repainting behaviour have not been independently verified for this indicator. Check the creator’s current publication and settings.
General descriptions and classifications are recovered research. Verified details above identify the specific checks we have completed. Check the creator’s current publication for later changes.