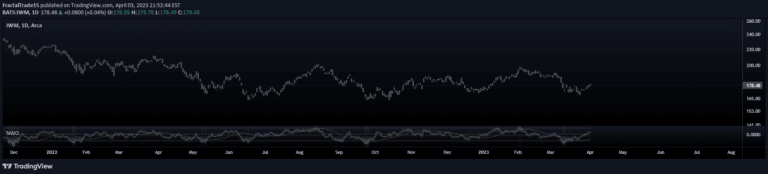
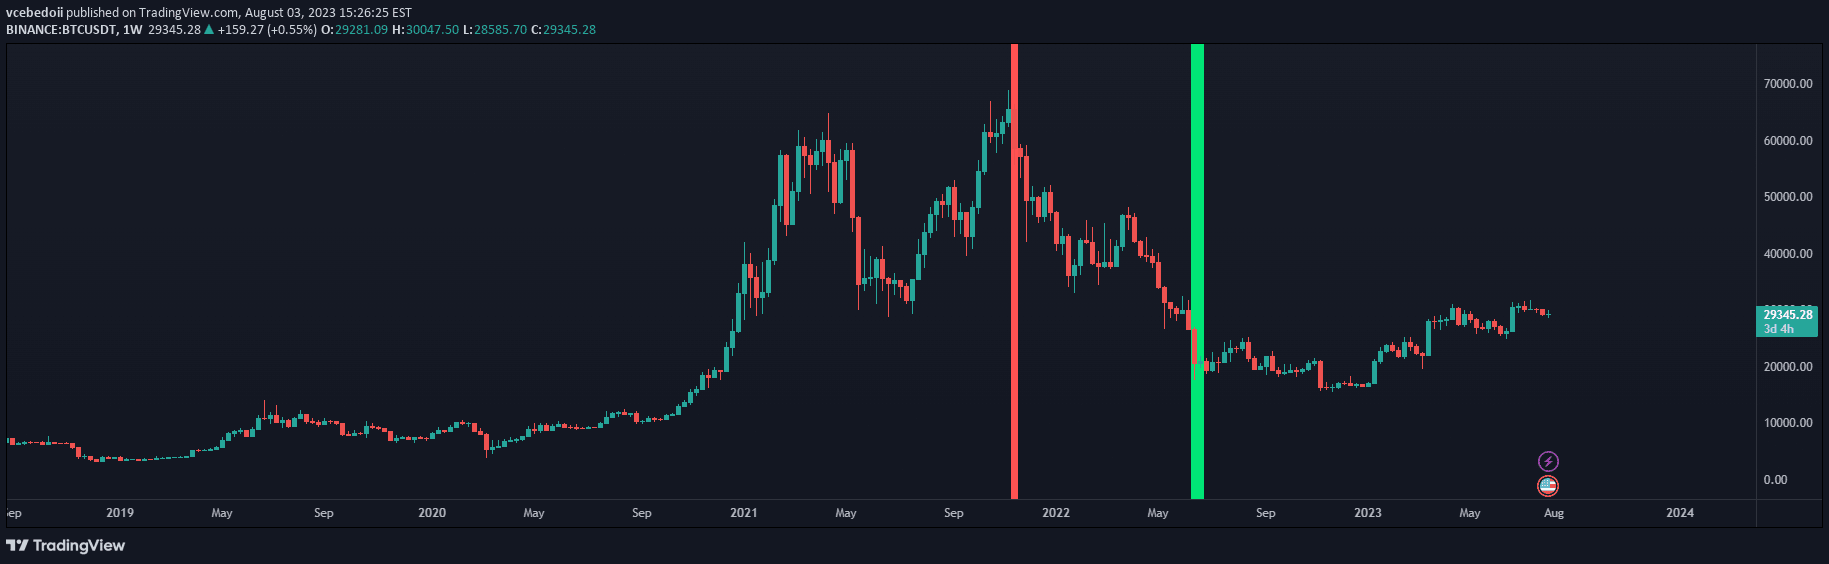
A VWAP Z-Score Oscillator that measures price deviation from the Volume Weighted Average Price, providing insights into market dynamics through standard deviation analysis.
Explore complementary indicator rolesHow it works
The VWAP Z-Score Oscillator calculates the statistical distance between the current price and the Volume Weighted Average Price (VWAP) using standard deviation. It transforms raw price differences into a standardized Z-Score, which represents how many standard deviations the price is from the VWAP mean.
The indicator allows traders to select different reset periods like Session, Week, Month, Quarter, or Year, enabling flexible analysis across various timeframes. By visualizing the Z-Score as an oscillator between ±3 sigma levels, traders can quickly interpret price deviation magnitude and potential market trends.
Why it may be useful
The VWAP Z-Score Oscillator provides traders with a powerful statistical tool to understand price momentum and potential market reversals. By quantifying price movements relative to the volume-weighted average, traders can identify statistically significant price deviations that might indicate overbought or oversold conditions.
The scaled table and oscillator visualization make complex statistical information immediately readable, allowing traders to make faster, more informed decisions about market entry and exit points.
When to explore it
This indicator works best in markets with clear volume trends and during periods of significant price movement. Traders can utilize it most effectively in liquid markets like stocks, futures, and forex, where volume data is robust and reliable.
The VWAP Z-Score Oscillator is particularly useful during volatile market conditions, helping traders identify potential trend reversals or continuation signals by highlighting extreme price deviations from the average.
Keep exploring
What we’ve verified
Access, alerts and repainting behaviour have not been independently verified for this indicator. Check the creator’s current publication and settings.
General descriptions and classifications are recovered research. Verified details above identify the specific checks we have completed. Check the creator’s current publication for later changes.