
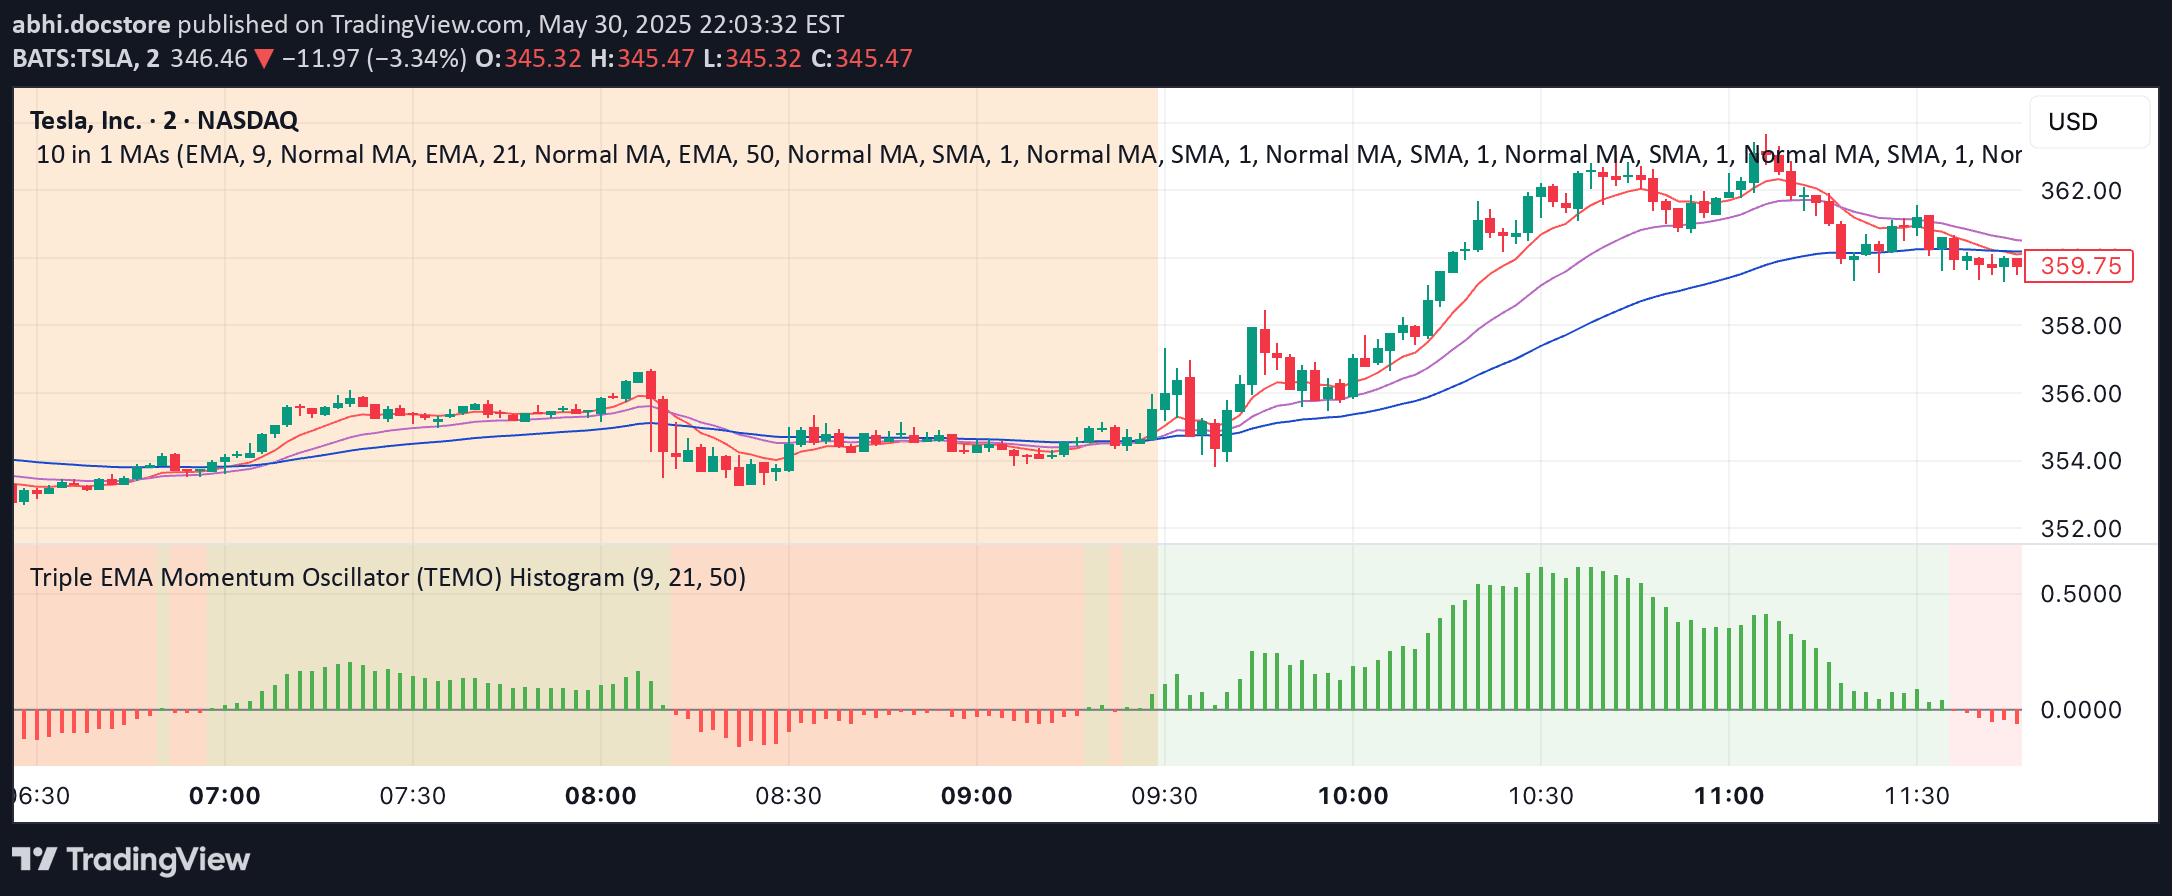
The Triple EMA Momentum Oscillator (TEMO) analyzes momentum by calculating EMA spreads and velocities to generate trading signals based on trend strength and direction.
Explore complementary indicator rolesHow it works
The Triple EMA Momentum Oscillator (TEMO) works by calculating exponential moving averages (EMAs) across three different periods: short, mid, and long. It first computes the EMAs and then determines the spread between these moving averages, which represents the current market trend's momentum.
The indicator then calculates the velocity of these spreads by measuring their rate of change. By combining the spread strength and velocity, normalized against the EMA values, TEMO creates a composite oscillator that helps traders understand the underlying market dynamics and potential trend reversals.
Why it may be useful
The TEMO is crucial for traders because it provides a comprehensive view of market momentum beyond simple moving average crossovers. By integrating multiple EMA periods and analyzing their relationships, traders can gain deeper insights into trend strength, potential reversals, and market sentiment.
This oscillator helps traders make more informed decisions by quantifying momentum changes and providing clear visual signals. Its ability to adapt to different market conditions and timeframes makes it a versatile tool for identifying potential entry and exit points across various trading strategies.
When to explore it
The TEMO is most effective in markets with clear trending characteristics, where momentum plays a significant role in price movement. It works best in liquid markets with sufficient price volatility, such as forex, stocks, and cryptocurrency trading, where rapid momentum shifts are common.
Traders should use TEMO in conjunction with other technical indicators to confirm signals and reduce false positives. It is particularly useful during periods of market transition, helping traders identify potential trend changes and momentum shifts before they become fully established.
Keep exploring
What we’ve verified
Access, alerts and repainting behaviour have not been independently verified for this indicator. Check the creator’s current publication and settings.
General descriptions and classifications are recovered research. Verified details above identify the specific checks we have completed. Check the creator’s current publication for later changes.


