Divergence Indicator (any oscillator)
A versatile divergence indicator that identifies potential trend reversals by comparing price action with an oscillator's momentum, adaptable to multiple technical indicators.
Explore 11,183 indicators. Filter beyond the obvious.
Discover the tools that fit the way you trade.
11,183 tools to explore
A versatile divergence indicator that identifies potential trend reversals by comparing price action with an oscillator's momentum, adaptable to multiple technical indicators.
A trading indicator that develops higher timeframe bias by analyzing previous day/week high and low price levels, providing a strategic approach to anticipating potential price movements.
A trading script combining Exponential Moving Averages (EMAs) and Stochastic RSI to identify market trends, momentum shifts, and potential entry or exit points for traders.
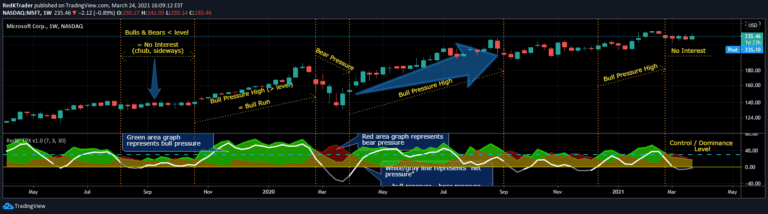
The RedK Trader Pressure Index (TPX) analyzes price bar changes to reveal the ongoing battle between bulls and bears, providing insights into market control and potential price action direction.
An advanced Open Interest indicator that provides comprehensive market insights through multiple visualization techniques and real-time statistical analysis of trading positions.
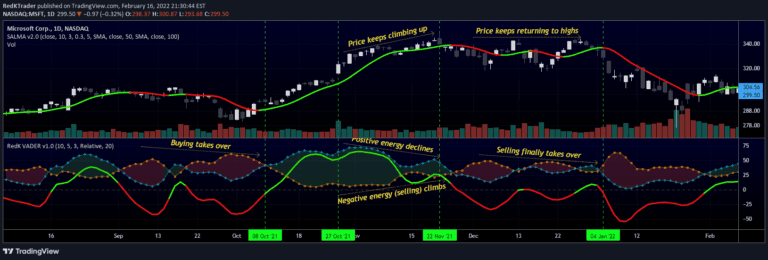
VADER is a volume-based technical indicator that measures market energy by analyzing price displacement and trading volume to determine bullish or bearish market sentiment.
ICT Algorithmic Macro Tracker plots key trading time windows based on Inner Circle Trader methodology, helping traders identify potential market movement periods across specific time intervals.
A price action scalping sequence identifying potential breakout opportunities by detecting two unsuccessful breakouts in the same direction, anticipating a third decisive move.
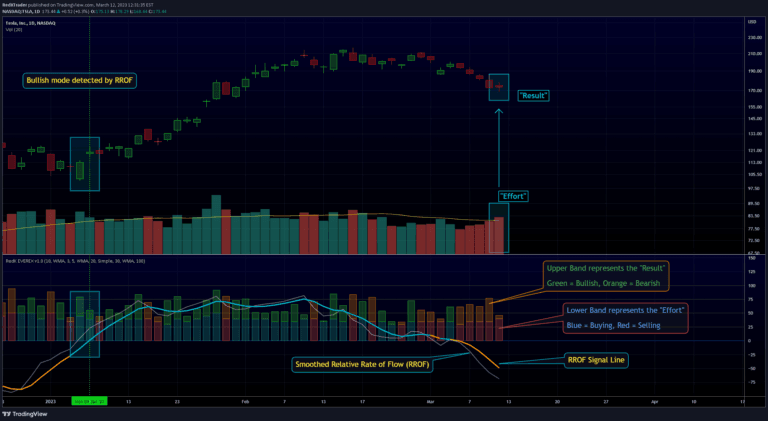
An experimental trading indicator that analyzes volume and price action using Volume Price Analysis and Wyckoff's Effort versus Result law to detect market strength and potential reversals.
A volume delta indicator that analyzes intrabar volume to estimate buying and selling pressure by calculating five distinct volume balances and divergence channels.
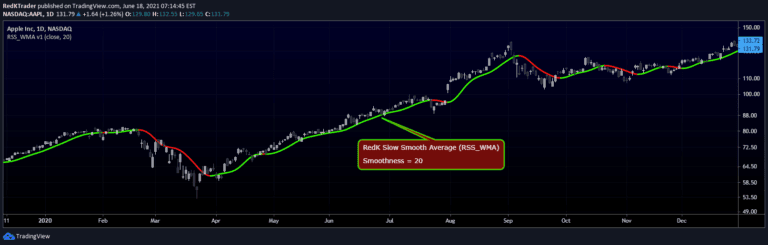
RedK Slow Smooth Average (RSS_WMA) is a specialized moving average designed to provide smooth trend visualization by filtering out short-term price noise through multiple weighted moving average passes.
Momentum Bars (Mo_Bars) is a three-moving average based indicator that visualizes relative momentum changes, helping traders identify potential trend shifts and momentum direction.
Likes, views, and comments are historical TradingView snapshots. They describe attention, not trading performance.