Super Secret 200 EMA
A trading indicator combining Supertrend and 200 EMA to identify market trends and potential buy/sell opportunities by analyzing price movements and moving averages.
Explore 11,183 indicators. Filter beyond the obvious.
Discover the tools that fit the way you trade.
11,183 tools to explore
A trading indicator combining Supertrend and 200 EMA to identify market trends and potential buy/sell opportunities by analyzing price movements and moving averages.
A predictive indicator that calculates the probability of moving average crossovers by analyzing potential future price movements and predicting MA interactions before they occur.
A dynamic moving average that adjusts its weighting based on market volatility, providing adaptive trend insights and potential entry/exit signals across different market conditions.
An advanced moving average crossover indicator that provides initial and re-entry trading signals using dual moving averages with customizable parameters and smart re-entry options.
A moving average-based reversal indicator that generates trading signals by tracking market price position relative to a 13-period moving average, identifying potential trend changes.
A comprehensive trading signal that combines supply and demand zones with EMA and RSI to generate dynamic buy and sell signals for enhanced market analysis and trade management.
A multi-timeframe moving average indicator that visualizes crossovers and interactions between up to eight moving averages across different timeframes and calculation types.
A dynamic moving average extension indicator that visually represents when a stock deviates from its baseline moving average, highlighting price movements and potential trend changes.
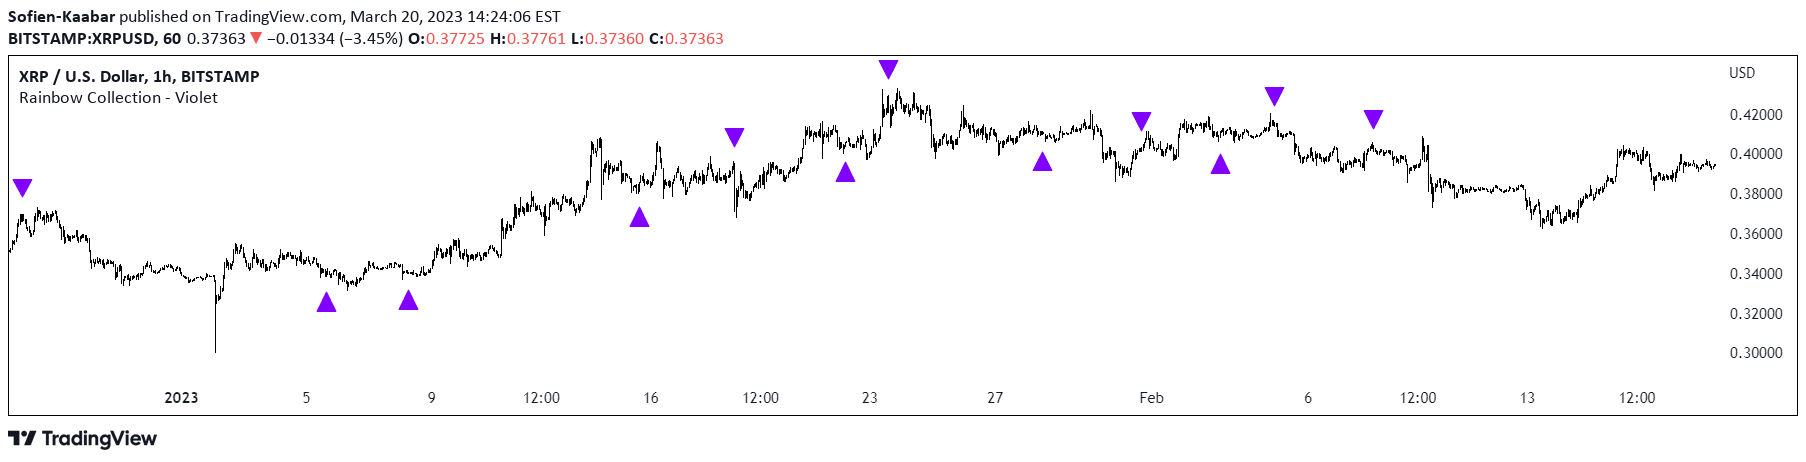
The Violet indicator uses a 20-period Hull moving average to identify potential market trend reversals by analyzing multiple historical price periods relative to their moving averages.
A specialized EMA indicator that eliminates distortions from low-volume post-market hours by allowing customizable trading session settings for more accurate trend analysis.
A trading indicator using Madrid Moving Averages (EMMM) to detect trend changes through crossovers between fast and slow moving averages, providing visual trend signals.
A multi-timeframe moving average comparison tool that tracks the relationship between fast and slow moving averages across different time periods, providing trend alignment insights.
Likes, views, and comments are historical TradingView snapshots. They describe attention, not trading performance.