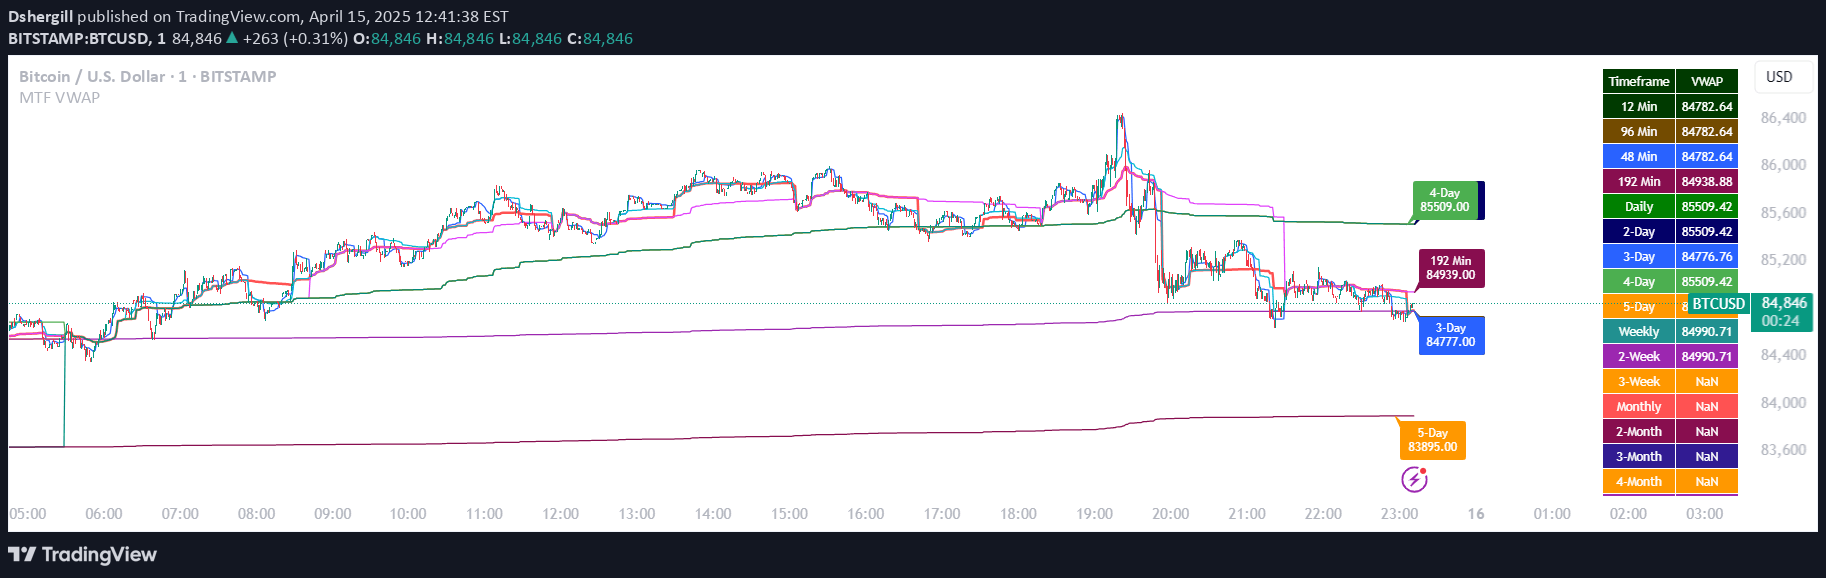
A multi-timeframe moving average comparison tool that tracks the relationship between fast and slow moving averages across different time periods, providing trend alignment insights.
Explore complementary indicator rolesHow it works
The Moving Average Continuity indicator compares the positioning of fast and slow moving averages across multiple selected timeframes. Users can customize the moving average type (EMA, SMA, HMA, WMA, VWMA) and specify the length for each moving average. The indicator calculates and displays the relative positions of these moving averages in a configurable table on the chart.
By analyzing the relationship between different moving averages, the tool provides a comprehensive view of trend alignment and potential market momentum. The system checks whether faster moving averages are trending above or below slower moving averages, offering traders a quick visual representation of trend continuity across multiple timeframes.
Why it may be useful
Moving average comparisons provide critical insights into market trends and potential directional movements. By examining multiple timeframes simultaneously, traders can gain a more comprehensive understanding of market dynamics beyond single-timeframe analysis. This approach helps traders identify potential trend confirmations and avoid false signals that might occur on a single timeframe.
The indicator's flexibility in moving average selection and timeframe comparison allows traders to adapt their analysis to different market conditions and trading styles. By offering a clear, concise visualization of trend alignment, the tool helps traders make more informed decisions about potential entry and exit points.
When to explore it
The Moving Average Continuity indicator is most effective in trending markets with clear directional movement. It works best when traders want to confirm trend strength and potential continuation across multiple timeframes. The tool is particularly useful for identifying consistent trend alignments and potential trend reversal points.
Traders should use this indicator in conjunction with other technical analysis tools to validate signals and reduce false positives. It is especially valuable for traders who want a quick, visual representation of trend alignment without getting overwhelmed by complex chart patterns or multiple technical indicators.
Keep exploring
What we’ve verified
Access, alerts and repainting behaviour have not been independently verified for this indicator. Check the creator’s current publication and settings.
General descriptions and classifications are recovered research. Verified details above identify the specific checks we have completed. Check the creator’s current publication for later changes.