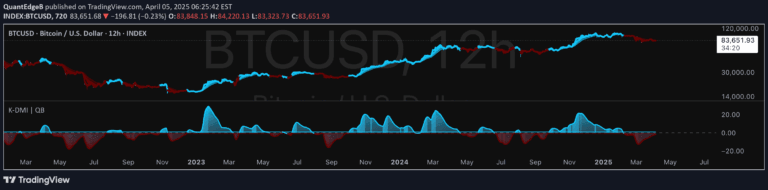
Wave Trend indicator is a sentiment analysis tool that helps traders understand market trends by calculating average investor satisfaction through colored squares on a chart.
Explore complementary indicator rolesHow it works
The Wave Trend indicator operates by analyzing investor sentiment through a specialized calculation method based on Mason's Line Indicator. It evaluates market trends by computing an average satisfaction level among investors, which is then represented visually through colored squares at the bottom of a trading chart.
The indicator offers two primary display parameters: showing squares based on distance to the Simple Moving Average (SMA) or displaying squares according to the satisfaction position on the indicator's scale. Traders can further customize the display by choosing between normalized and non-normalized dataset representations, providing flexibility in interpreting market sentiment.
Why it may be useful
The Wave Trend indicator provides traders with a unique perspective on market sentiment by translating complex investor satisfaction data into easily interpretable visual signals. By offering a structured approach to understanding market dynamics, it helps traders make more informed decisions about potential trend movements and investor psychology.
This tool is particularly valuable because it transforms abstract sentiment analysis into concrete, color-coded indicators that can be quickly understood. It enables traders to gain insights into market mood and potential trend shifts without requiring extensive technical analysis skills, making complex market information more accessible.
When to explore it
The Wave Trend indicator is most effective when used on longer timeframes, making it ideal for swing trading and long-term investment strategies. It is specifically designed to provide meaningful insights over extended periods, allowing traders to capture broader market trends and sentiment shifts.
Traders should consider using this indicator when seeking a comprehensive view of market sentiment that goes beyond traditional price-based analysis. It is particularly useful for investors who want to understand underlying market psychology and potential trend reversals, but should always be used in conjunction with other technical analysis tools and robust risk management strategies.
Keep exploring
What we’ve verified
Access, alerts and repainting behaviour have not been independently verified for this indicator. Check the creator’s current publication and settings.
General descriptions and classifications are recovered research. Verified details above identify the specific checks we have completed. Check the creator’s current publication for later changes.