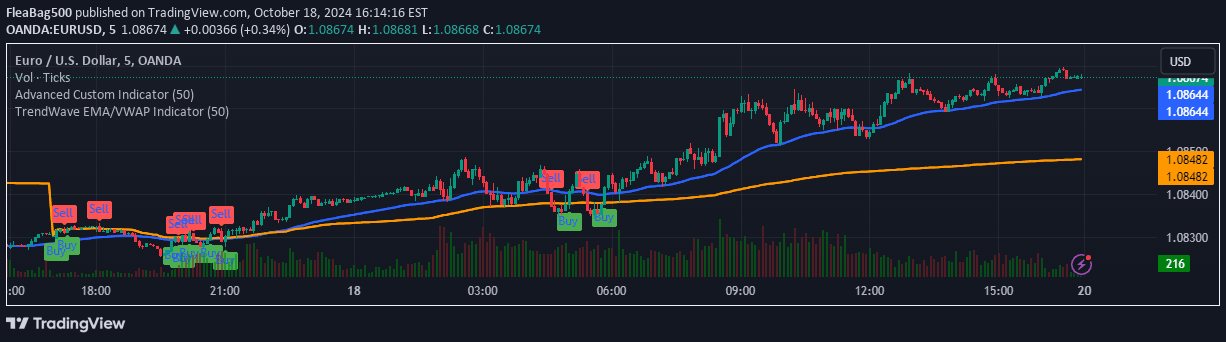
An advanced indicator tracking EMA and SMA crossovers with histogram visualization to identify potential support, resistance, and momentum shifts in market trends.
Explore complementary indicator rolesHow it works
The indicator calculates both Simple Moving Average (SMA) and Exponential Moving Average (EMA) based on user-defined parameters and selected price data source. It tracks the relationship between these moving averages, identifying crossover and crossunder events that signal potential trend changes.
When the EMA crosses above the SMA, the indicator generates a bullish signal, displaying green colors. Conversely, when the EMA crosses below the SMA, a bearish signal is produced with red colors. The accompanying histogram bars visualize price deviations from the SMA, providing additional insight into potential support and resistance levels.
Why it may be useful
The indicator offers traders a comprehensive view of market dynamics by combining multiple analytical techniques into a single, intuitive visualization. By integrating moving average crossovers with histogram-based deviation analysis, traders can quickly assess market momentum and potential trend reversals.
This approach provides a multi-layered perspective on price movements, allowing traders to make more informed decisions. The flexible design enables customization of moving average lengths and data sources, making it adaptable to various trading strategies and market conditions.
When to explore it
The indicator is most effective in markets with clear trending characteristics, where price movements show discernible momentum and directional shifts. It performs particularly well in liquid markets with sufficient price volatility, such as major forex pairs, stock indices, and prominent cryptocurrencies.
Traders should utilize this indicator across multiple timeframes, from short-term scalping to longer-term swing trading. It is especially valuable during periods of market transition, helping identify potential entry and exit points by highlighting critical support and resistance levels through its innovative histogram visualization.
Keep exploring
What we’ve verified
Access, alerts and repainting behaviour have not been independently verified for this indicator. Check the creator’s current publication and settings.
General descriptions and classifications are recovered research. Verified details above identify the specific checks we have completed. Check the creator’s current publication for later changes.