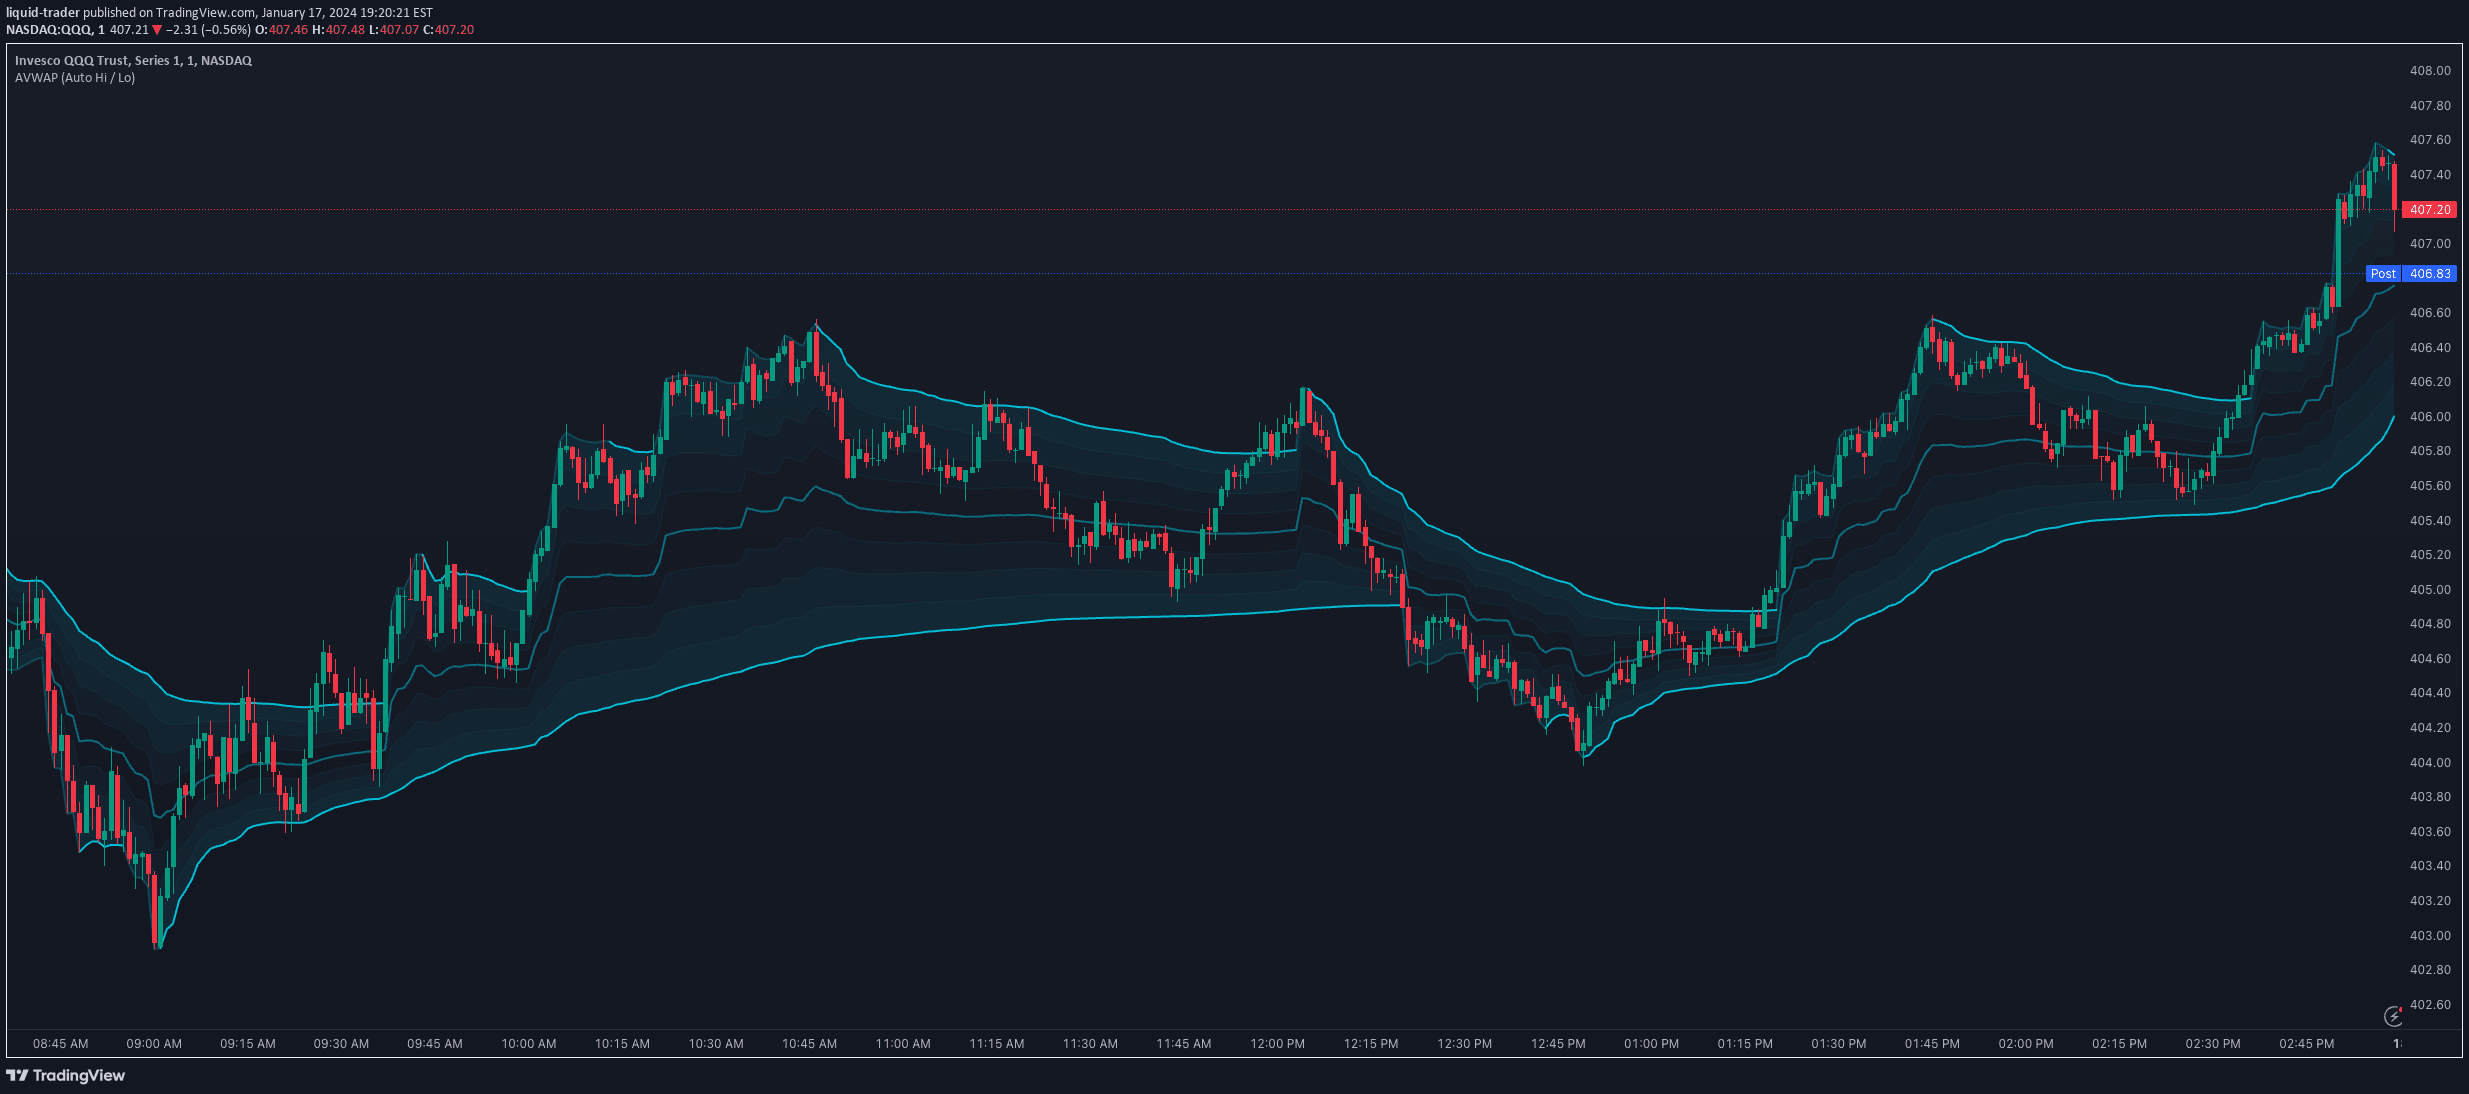
A multi-timeframe VWAP indicator providing four customizable rolling volume-weighted average price lines to analyze market trends and trading dynamics across different timeframes.
Explore complementary indicator rolesHow it works
The VWAP indicator calculates a volume-weighted average price by multiplying each price point by its corresponding trading volume and then dividing by the total volume traded during the specified period. This multi-timeframe approach creates four distinct VWAP lines with adjustable periods ranging from 7 to 365 days, allowing traders to observe price dynamics across different time horizons.
Each VWAP line represents a different timeframe perspective: fast (7 days), medium (90 days), slow (30 days), and long-term (365 days). By analyzing these lines simultaneously, traders can identify trend strength, potential support and resistance levels, and market sentiment across multiple timeframes.
Why it may be useful
The multi-timeframe VWAP indicator provides traders with a comprehensive view of price action that goes beyond traditional moving averages by incorporating trading volume. Volume-weighted calculations offer more precise insights into true market dynamics, revealing where significant trading activity occurs and how price moves relative to overall market participation.
By presenting four different VWAP lines, traders can better understand short-term fluctuations, medium-term trends, and long-term market structure. This approach helps identify potential trend reversals, confirm momentum, and make more informed trading decisions across various market conditions.
When to explore it
The multi-timeframe VWAP indicator is most effective in liquid markets with consistent trading volume, such as major stock indices, forex pairs, and heavily traded commodities. Traders can utilize this tool during both trending and range-bound market conditions to assess price strength and potential directional shifts.
Ideal usage includes identifying key support and resistance levels, confirming trend direction, and evaluating potential entry and exit points across different trading timeframes. Traders should combine this indicator with other technical analysis tools to validate signals and improve overall trading strategy effectiveness.
Keep exploring
What we’ve verified
Access, alerts and repainting behaviour have not been independently verified for this indicator. Check the creator’s current publication and settings.
General descriptions and classifications are recovered research. Verified details above identify the specific checks we have completed. Check the creator’s current publication for later changes.