Mxwll Price Action Suite [Mxwll]
Advanced trading indicator providing comprehensive market structure analysis with customizable sensitivities, identifying price action patterns, order blocks, and session dynamics for strategic trading decisions.
Explore 11,183 indicators. Filter beyond the obvious.
Discover the tools that fit the way you trade.
11,183 tools to explore
Advanced trading indicator providing comprehensive market structure analysis with customizable sensitivities, identifying price action patterns, order blocks, and session dynamics for strategic trading decisions.
The Ultimate RSI is an advanced oscillator that enhances traditional RSI by emphasizing trend dynamics, providing more precise insights into market momentum and directional movements.
Periodic Linear Regressions (PLR) calculates linear trend lines over customizable periods, helping traders identify underlying price trends and potential support/resistance zones.
A custom moving average using a beta distribution weighting function that allows traders to control lag and smoothness, offering flexible trend analysis with adjustable parameters.
Rolling Volume-Weighted Average Price (RVWAP) is a dynamic indicator that calculates a moving average price weighted by volume across a flexible time window, adapting to different chart timeframes.
An adaptive MACD oscillator that dynamically adjusts to market conditions, filtering noise and capturing trend variations by interpolating between different filter coefficients.
A trading signal using Kadane's algorithm to identify the largest market impulse within a window, then applying Murrey's math lines to map potential price movements and trading opportunities.
A performance evaluation tool that calculates risk-adjusted return metrics like Sharpe, Sortino, and Omega Ratios to help traders assess investment performance and risk.
A meme-inspired trading indicator that identifies a McDonald's logo-shaped pattern using cubic Bezier curves, detecting specific market tops and bottoms with a unique visual representation.
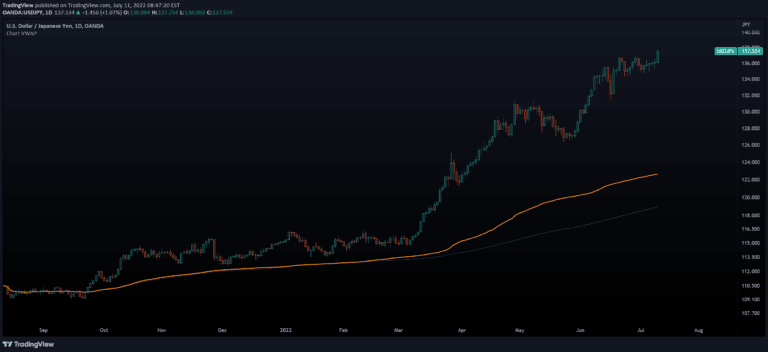
A dynamic Volume-Weighted Average Price (VWAP) indicator that calculates on visible chart bars, offering traders a flexible way to analyze price movement and volume across different chart views.
A comprehensive TradingView indicator that identifies support and resistance levels using pivot points and volume data, helping traders predict potential market turning points and trading zones.
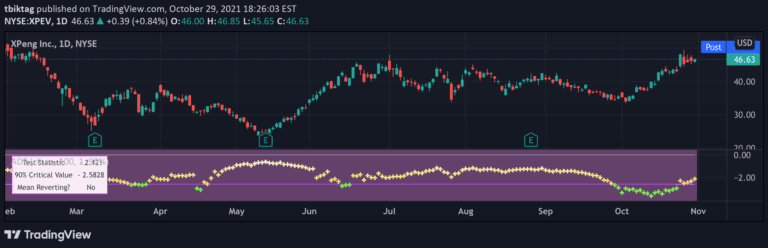
The Augmented Dickey-Fuller test statistically evaluates mean reversion in price series by analyzing the tendency of prices to return to an average level over time.
Likes, views, and comments are historical TradingView snapshots. They describe attention, not trading performance.