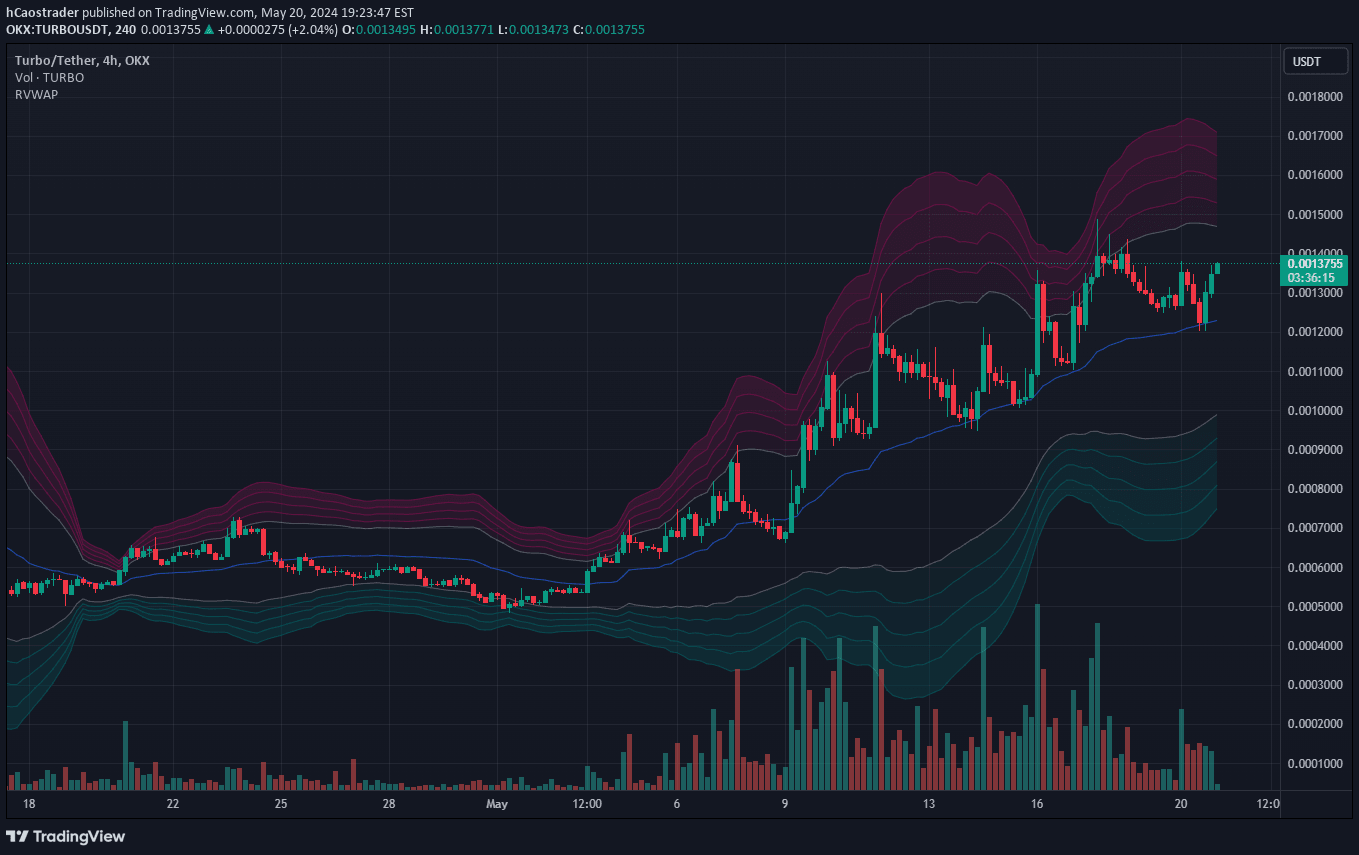
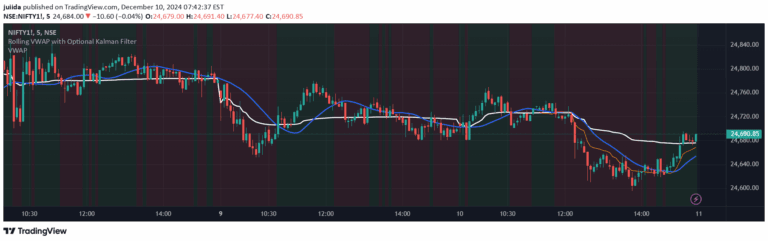
Rolling Volume-Weighted Average Price (RVWAP) is a dynamic indicator that calculates a moving average price weighted by volume across a flexible time window, adapting to different chart timeframes.
Explore complementary indicator rolesHow it works
The Rolling VWAP calculates a volume-weighted average price using a moving time window that automatically adjusts to the chart's timeframe. It continuously tracks price and volume data within a specified period, which can range from hours to months depending on the chart's resolution.
The indicator uses a sophisticated algorithm that maintains an array of values without requiring complex lookback loops. It ensures consistent calculation by maintaining a minimum number of bars in the window, even during market gaps or non-trading periods
Why it may be useful
RVWAP provides traders with a more stable and continuous price assessment compared to traditional VWAP indicators. It offers insights into the average price traders are paying, weighted by volume, across different market conditions.
The indicator helps identify potential support and resistance levels, trend directions, and market sentiment. By adapting to various timeframes, it becomes a versatile tool for traders across different markets and trading styles
When to explore it
RVWAP works best in markets with consistent volume data and during trend identification scenarios. It is particularly useful for day traders and swing traders analyzing intraday and multi-day price movements.
Traders should use RVWAP when seeking a comprehensive view of price action that incorporates trading volume. It performs exceptionally well in liquid markets with regular trading volumes, such as major stock indices, forex pairs, and actively traded commodities
Keep exploring
What we’ve verified
Access, alerts and repainting behaviour have not been independently verified for this indicator. Check the creator’s current publication and settings.
General descriptions and classifications are recovered research. Verified details above identify the specific checks we have completed. Check the creator’s current publication for later changes.