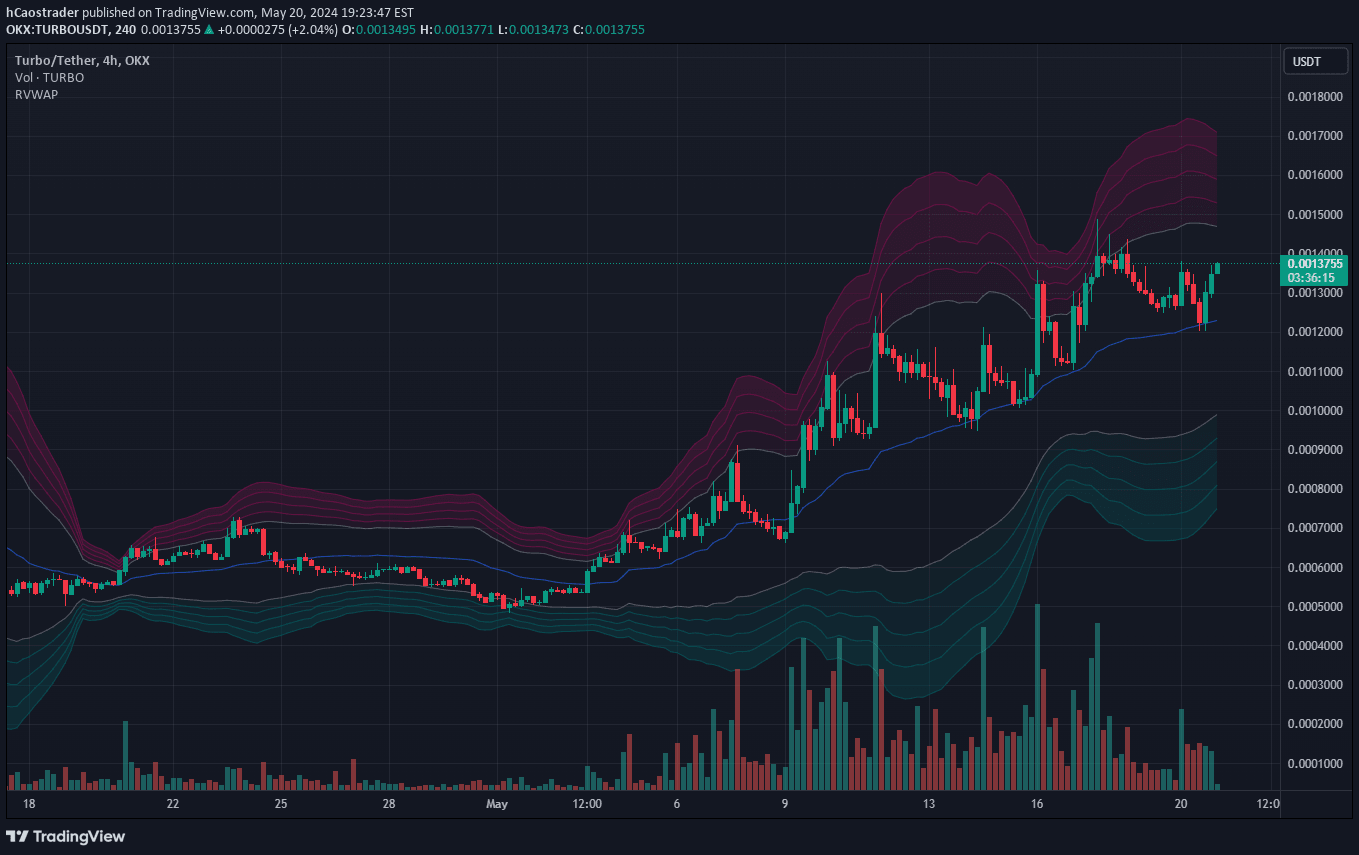
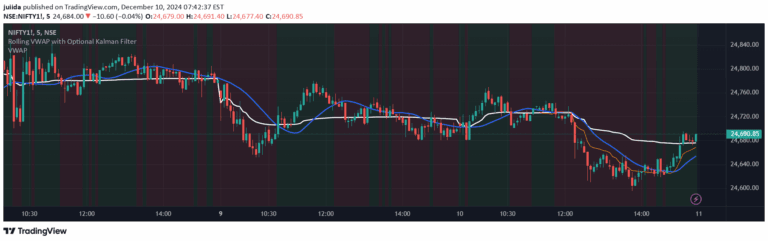
Rolling VWAP is a dynamic volume-weighted average price indicator that helps traders assess market trends by calculating average price based on trading volume over a specific period.
Explore complementary indicator rolesHow it works
The Rolling VWAP calculates the average price of an asset by multiplying each price point by its corresponding trading volume and then dividing by the total volume over a specified number of bars. This method ensures that periods with higher trading volume have more significant impact on the average price calculation. Traders can customize the number of bars used in the calculation, allowing for flexible analysis across different trading timeframes.
As new price and volume data become available, the Rolling VWAP dynamically updates, providing a real-time representation of the asset's weighted average price. The indicator creates a moving line on the chart that traders can use to identify potential support and resistance levels, trend direction, and market sentiment based on price positioning relative to the VWAP line.
Why it may be useful
The Rolling VWAP provides traders with a more nuanced view of price action by incorporating trading volume into the average price calculation. Unlike simple moving averages, this indicator offers deeper insights into market dynamics by giving more weight to periods with significant trading activity. It helps traders understand where the majority of trading has occurred and can reveal underlying market sentiment.
By showing the relationship between price and volume, the Rolling VWAP can help traders make more informed decisions about potential entry and exit points. It serves as a powerful tool for confirming trends, identifying potential reversals, and understanding the overall strength of price movements across different financial markets and trading instruments.
When to explore it
The Rolling VWAP is most effective when used in markets with consistent trading volume and clear price trends. Intraday traders can benefit from shorter period settings (5-14 bars) to capture quick market movements and short-term trading opportunities. These shorter periods provide more responsive signals for rapid decision-making in volatile markets.
Swing traders and longer-term investors can utilize longer VWAP periods (50-100 bars) to analyze broader market trends and identify more significant support and resistance levels. The indicator works exceptionally well when combined with other technical analysis tools like momentum indicators, volume analysis, and moving averages to confirm signals and provide a comprehensive market analysis.
Keep exploring
What we’ve verified
Access, alerts and repainting behaviour have not been independently verified for this indicator. Check the creator’s current publication and settings.
General descriptions and classifications are recovered research. Verified details above identify the specific checks we have completed. Check the creator’s current publication for later changes.