Quadratic Regression
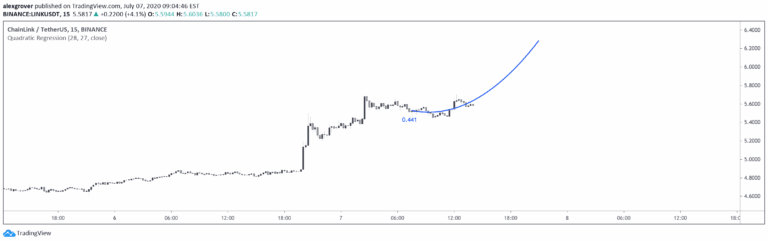
A quadratic regression indicator that fits a parabolic curve to price data, allowing traders to analyze non-linear trends and potentially forecast future price movements.
Explore 11,183 indicators. Filter beyond the obvious.
Discover the tools that fit the way you trade.
11,183 tools to explore
A quadratic regression indicator that fits a parabolic curve to price data, allowing traders to analyze non-linear trends and potentially forecast future price movements.
Kernel Regression Ribbon is an advanced trend identification tool using multiple kernel regressions to visualize support, resistance, and price movement adaptively.
The Relational Quadratic Kernel Channel is an advanced price analysis tool that uses kernel smoothing to estimate trend channels and provide potential price extremes.
A quadratic weighted indicator that provides dynamic market trend and volatility analysis, utilizing advanced filtering techniques to create responsive and smooth bands around price movement.
An advanced Fair Value Gap indicator that identifies regular and inverse market gaps across multiple timeframes, providing precise support/resistance zones and potential trading signals.
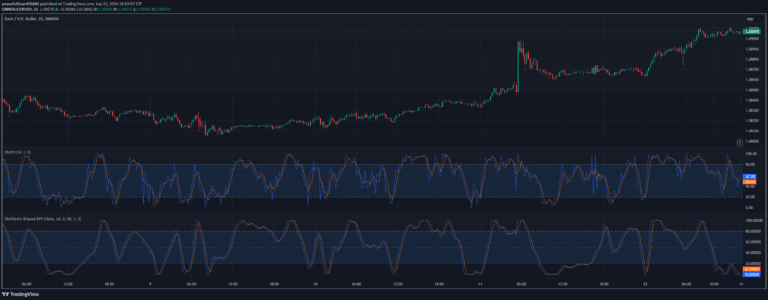
A comprehensive multi-timeframe stochastic indicator that combines four independent stochastic readings to provide advanced momentum analysis and trend confirmation signals.
An advanced Keltner Channel indicator utilizing sophisticated statistical methods to analyze price action, volatility, and momentum through a dynamic overlay and complementary oscillator.
A quadratic kernel regression indicator that provides adaptive trend analysis through a central line and dynamic deviation bands, helping traders identify market momentum and potential reversals.
A refined MACD indicator using a biquad band pass filter to identify momentum and trend changes with enhanced precision and adaptability in price movements.
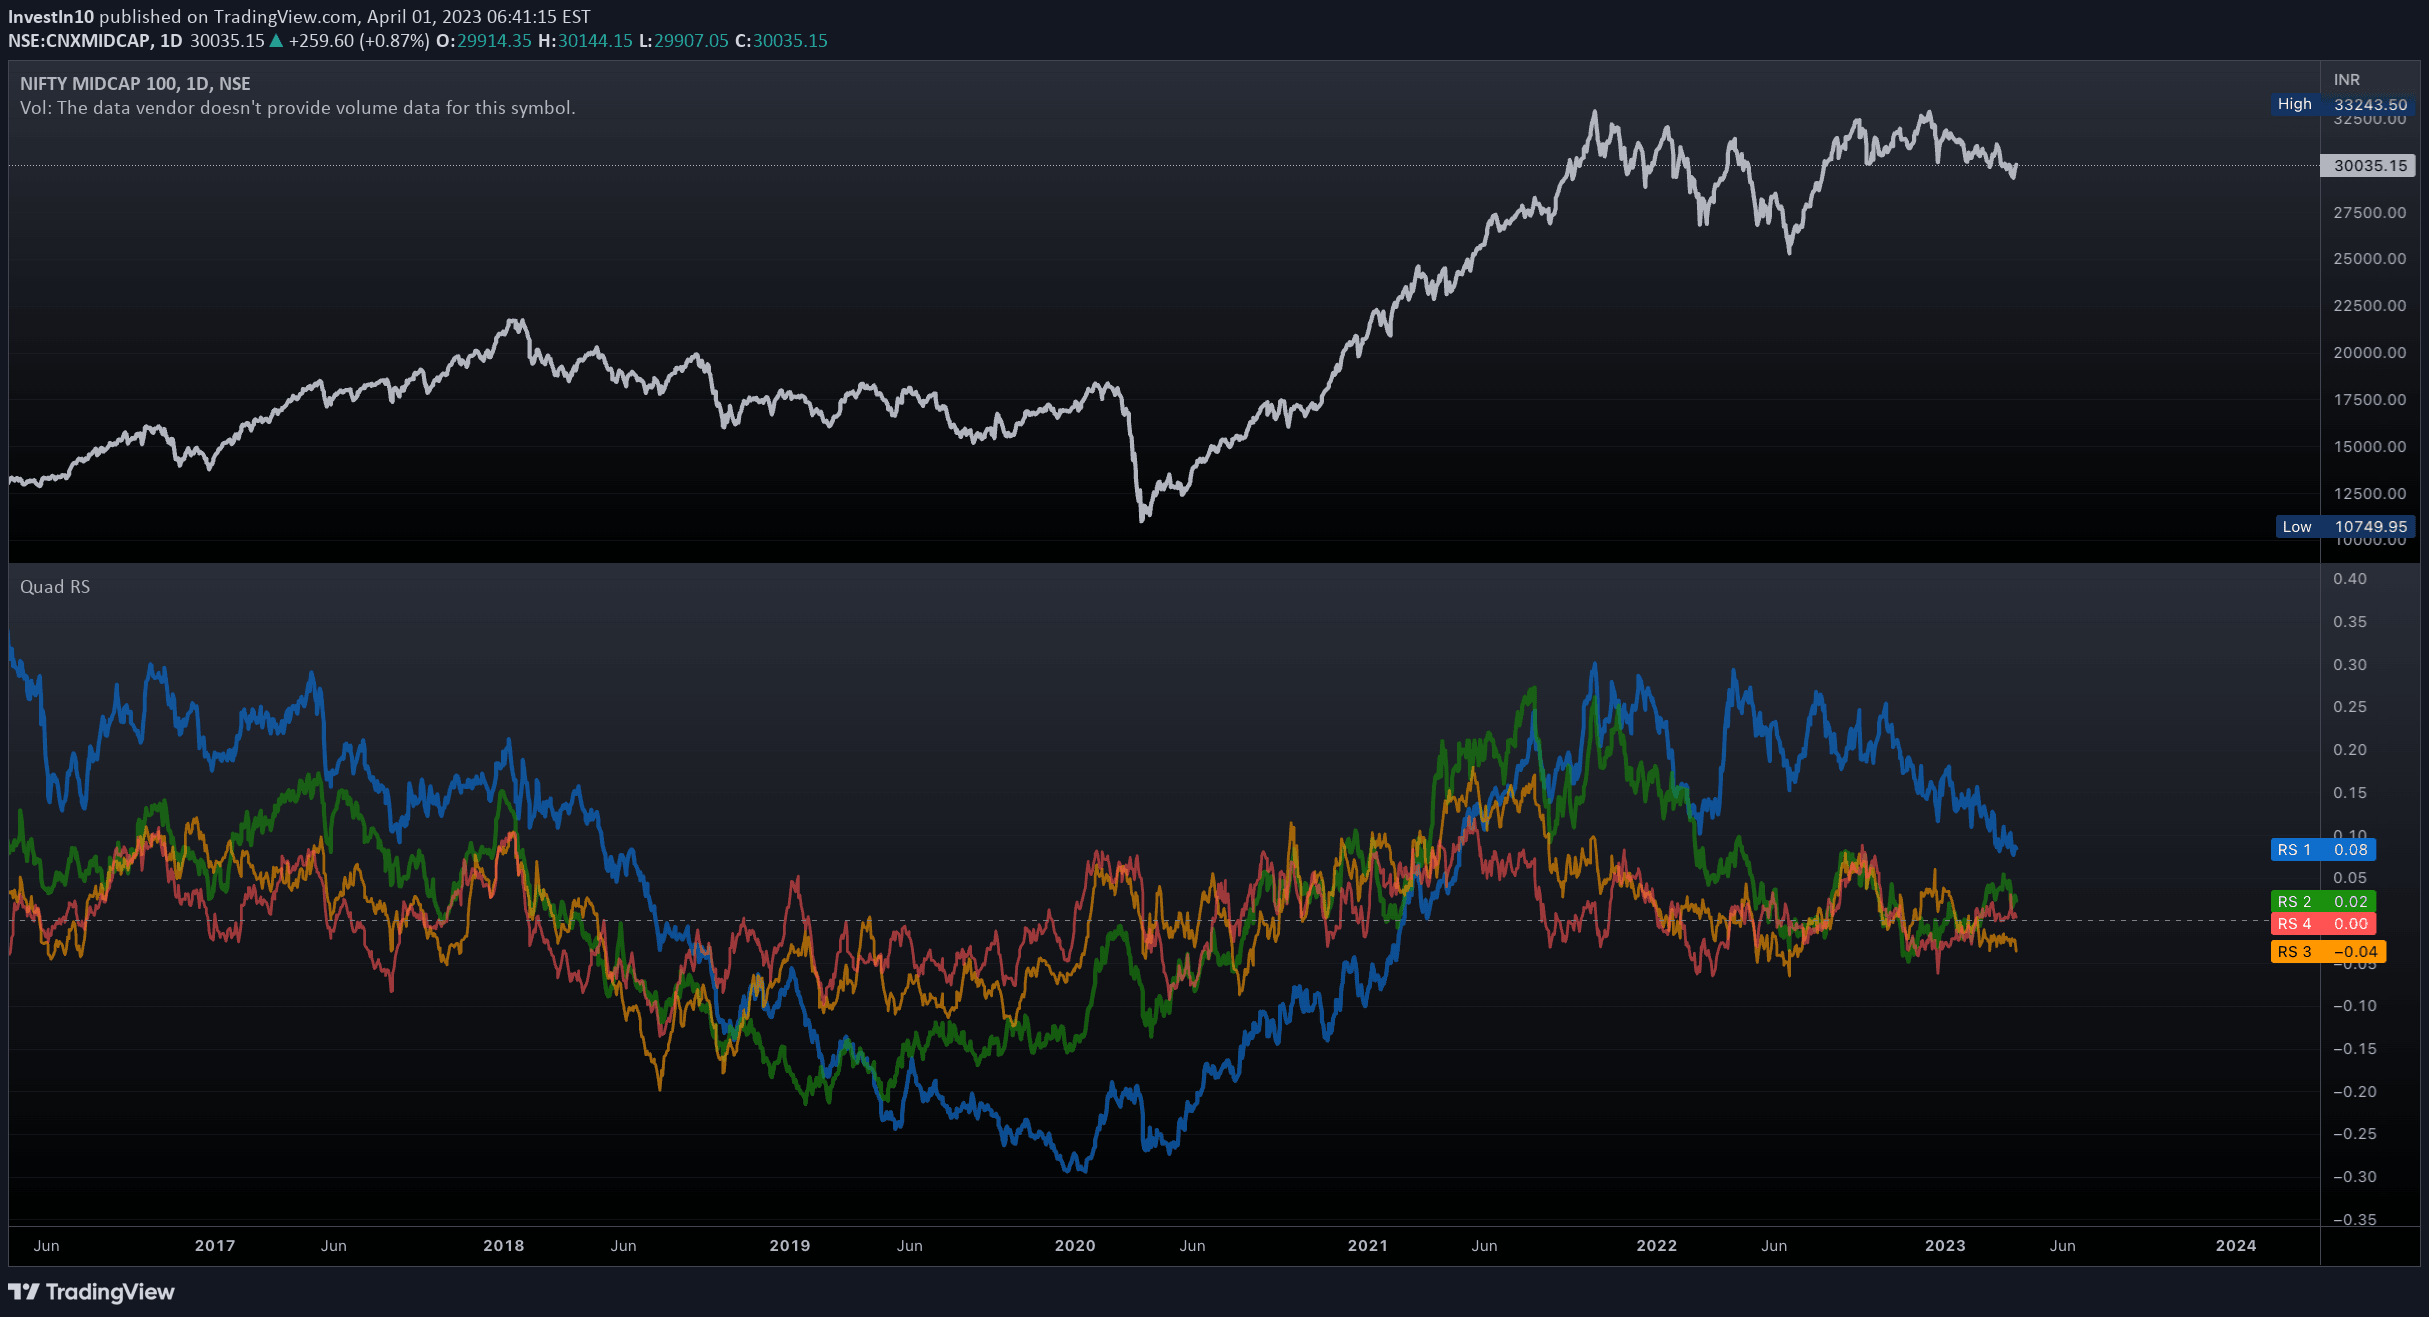
Relative Strength measures a stock's performance compared to a benchmark index or another stock, helping traders identify momentum and comparative strength across different assets.
A multi-timeframe VWAP indicator providing four customizable rolling volume-weighted average price lines to analyze market trends and trading dynamics across different timeframes.
A unique trading indicator combining a biquad band pass filter with the stochastic oscillator to analyze price movements by isolating specific frequency bands and measuring momentum.
Likes, views, and comments are historical TradingView snapshots. They describe attention, not trading performance.