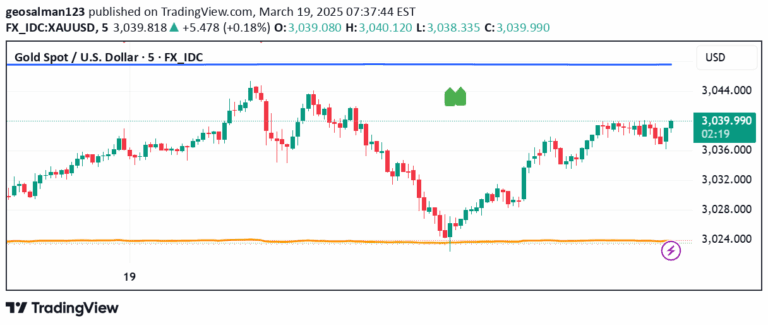
An advanced Keltner Channel indicator utilizing sophisticated statistical methods to analyze price action, volatility, and momentum through a dynamic overlay and complementary oscillator.
Explore complementary indicator rolesHow it works
The indicator combines a Keltner Channel overlay with an oscillator, using a biquad low-pass filter to create a smooth center line representing price trend. It calculates channel boundaries using a statistically derived Average True Range (ATR) that incorporates root mean square and z-score methodologies to measure market volatility.
The oscillator component maps price position within the channel to a normalized scale, featuring a main oscillator line and a signal line. These lines interact to provide trading signals, with crossovers indicating potential momentum shifts and extreme values suggesting overbought or oversold conditions.
Why it may be useful
This advanced indicator provides traders with a comprehensive view of market dynamics by simultaneously analyzing trend, momentum, and volatility through a sophisticated mathematical approach. Its unique ATR calculation offers more responsive and accurate volatility measurement compared to traditional methods, enabling traders to better understand market conditions.
The combination of overlay and oscillator components allows for multi-dimensional market analysis, reducing the likelihood of false signals and providing more nuanced insights into potential price movements and trend reversals.
When to explore it
The indicator is most effective in markets with clear trending characteristics and moderate to high volatility, where its advanced statistical methods can provide meaningful insights into price action. It performs exceptionally well in assets that exhibit recurring price patterns and where momentum shifts are significant indicators of potential trend changes.
Traders should consider using this indicator during periods of market transition, such as when price is approaching key support or resistance levels, or when seeking confirmation of potential trend reversals across multiple timeframes.
Keep exploring
What we’ve verified
Access, alerts and repainting behaviour have not been independently verified for this indicator. Check the creator’s current publication and settings.
General descriptions and classifications are recovered research. Verified details above identify the specific checks we have completed. Check the creator’s current publication for later changes.