Prediction Based on Linreg & Atr
A predictive trading algorithm using linear regression and multiple technical indicators to forecast asset prices over the next 20 periods by analyzing market trends and volatility.
Explore 11,183 indicators. Filter beyond the obvious.
Discover the tools that fit the way you trade.
11,183 tools to explore
A predictive trading algorithm using linear regression and multiple technical indicators to forecast asset prices over the next 20 periods by analyzing market trends and volatility.
A predictive trading tool using Fibonacci retracement levels to create future price channels and anticipate potential market movements across different time frames.
A trading signal that identifies potential buy and sell opportunities by analyzing sudden volume surges combined with RSI overbought and oversold conditions.
An adaptive trailing stop system with dynamic price targets and protection zones, providing comprehensive position management across different market conditions and volatilities.
A multi-timeframe Fibonacci linear regression strategy that analyzes market trends across different time frames, providing dynamic trading insights through regression channels and Fibonacci levels.
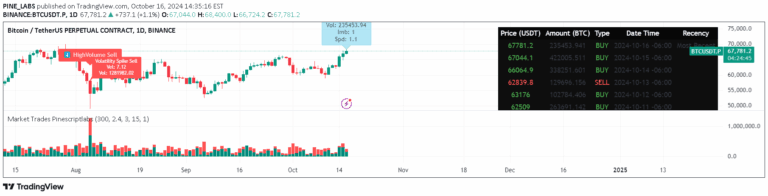
A trading algorithm that analyzes real-time order book data to identify market activity, volatility spikes, and trade imbalances through volume and price movement analysis.
The True Strength Index (TSI) is a technical indicator that measures trend strength and direction by analyzing price momentum and potential market reversals.
A quadratic kernel regression indicator that provides adaptive trend analysis through a central line and dynamic deviation bands, helping traders identify market momentum and potential reversals.
A comprehensive technical analysis indicator combining MACD, moving averages, and ATR bands to provide trend direction, momentum, and potential reversal points across different market conditions.
Multi-timeframe linear regression channels that visualize price trends across different time horizons, helping traders identify trend direction, support/resistance levels, and market dynamics.
A statistical model analyzing price spread between two instruments using stationarity tests and Z-score to determine potential trading signals based on market deviation.
A dynamic algorithmic trading signal that uses statistical calculations, technical analysis, and Bayesian theory to forecast future price movements with probabilistic uncertainty ranges.
Likes, views, and comments are historical TradingView snapshots. They describe attention, not trading performance.