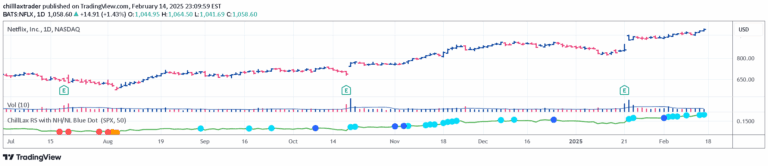
The True Strength Index (TSI) is a technical indicator that measures trend strength and direction by analyzing price momentum and potential market reversals.
Explore complementary indicator rolesHow it works
The True Strength Index (TSI) operates by calculating momentum through price changes and smoothing those calculations using multiple moving averages. It generates buy and sell signals by tracking the TSI line's relationship with predefined threshold values, indicating potential market conditions.
When the TSI falls below the buy threshold, it suggests an oversold market condition, potentially signaling a buying opportunity. Conversely, when the TSI rises above the sell threshold, it indicates an overbought market, potentially suggesting a selling opportunity.
Why it may be useful
The TSI helps traders identify potential trend reversals and market momentum by providing a nuanced view of price movement beyond simple price action. It offers insights into market psychology by measuring the strength and direction of price trends, allowing traders to make more informed decisions.
By combining multiple moving average calculations, the TSI provides a sophisticated approach to understanding market dynamics, helping traders recognize potential entry and exit points with greater precision and confidence.
When to explore it
The True Strength Index is most effective in markets with clear trending characteristics, where price movements demonstrate consistent momentum. It performs well in both bullish and bearish market conditions, offering traders versatile signal generation across different asset classes and timeframes.
Traders should use the TSI in conjunction with other technical indicators to confirm signals and reduce false positives. It is particularly useful in volatile markets where quick identification of potential trend reversals can provide significant trading advantages.
Keep exploring
What we’ve verified
Access, alerts and repainting behaviour have not been independently verified for this indicator. Check the creator’s current publication and settings.
General descriptions and classifications are recovered research. Verified details above identify the specific checks we have completed. Check the creator’s current publication for later changes.