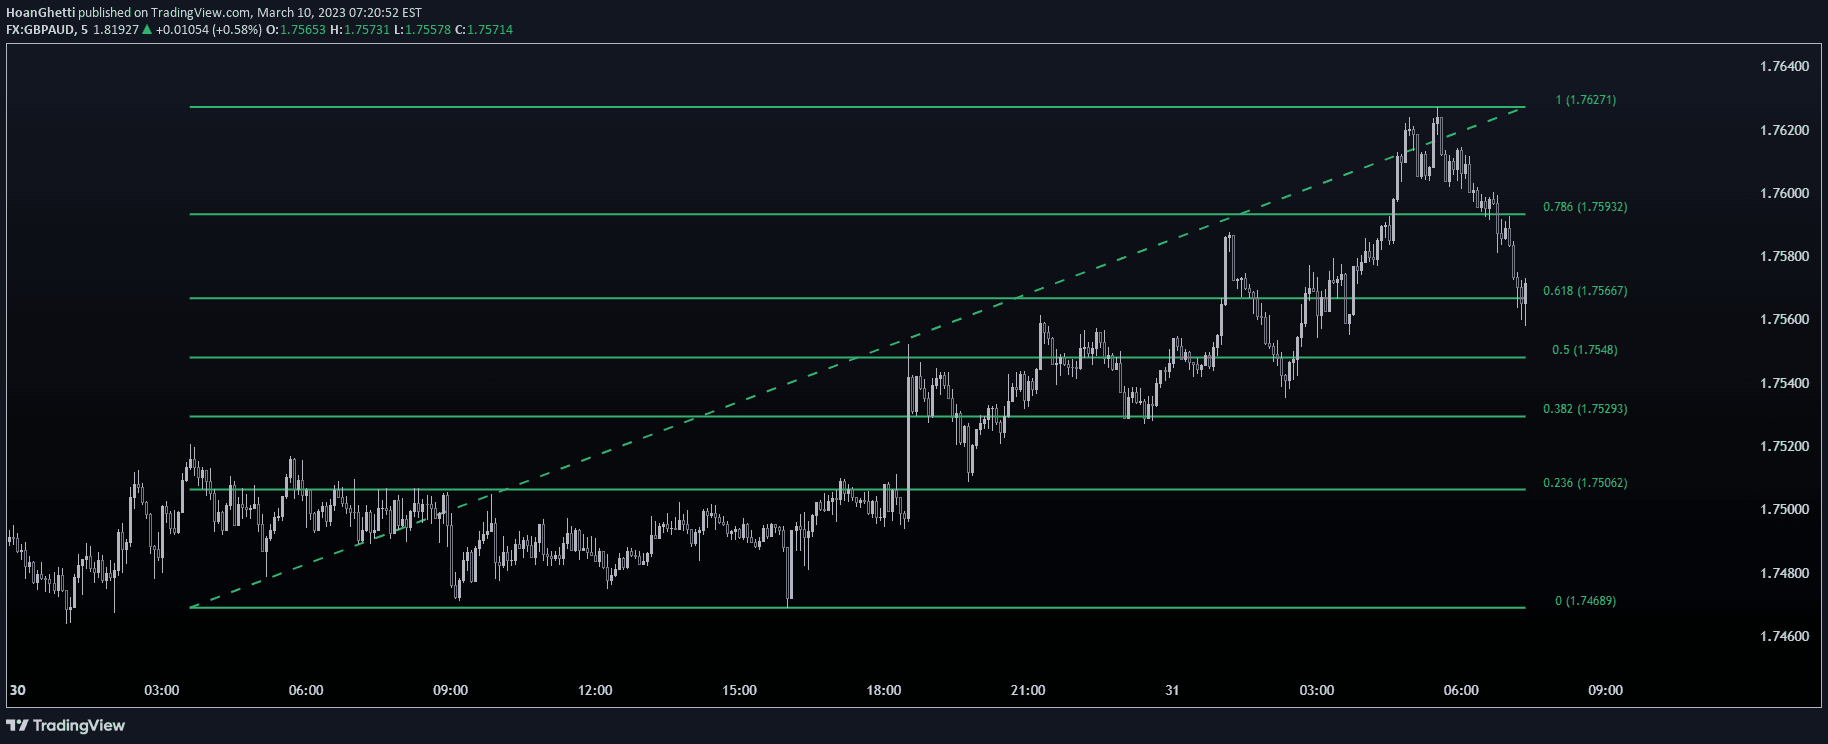
A predictive trading tool using Fibonacci retracement levels to create future price channels and anticipate potential market movements across different time frames.
Explore complementary indicator rolesHow it works
Fibonacci prediction channels are created by plotting parallel levels based on historical price action and extending them into future time periods. These levels are calculated using specific Fibonacci ratios that identify potential support and resistance zones where price might react or change direction.
The algorithm determines these levels by analyzing a predetermined number of previous price periods, creating a visual 'map' of potential future price interactions. Each consecutive Fibonacci level represents a potential channel where price movements are expected to occur, with traders monitoring how price interacts with these projected lines.
Why it may be useful
Fibonacci prediction channels provide traders with a strategic framework for understanding potential future price movements based on historical market behavior. By visualizing potential support and resistance zones, traders can anticipate and plan potential entry and exit points with greater precision.
These channels offer a unique perspective on market dynamics, helping traders identify potential trend reversals, breakout opportunities, and price interaction zones. The method transforms historical price data into a forward-looking predictive tool that enhances decision-making and risk management strategies.
When to explore it
Fibonacci prediction channels are most effective in markets with clear trending behavior and moderate volatility, where price movements tend to respect historical support and resistance levels. They work best when applied to liquid financial instruments with sufficient historical price data to generate accurate projections.
Traders should use these channels in conjunction with other technical analysis tools to confirm signals and validate potential trade setups. They are particularly useful during periods of consolidation or when seeking to identify potential trend continuation or reversal points across different timeframes.
Keep exploring
What we’ve verified
Access, alerts and repainting behaviour have not been independently verified for this indicator. Check the creator’s current publication and settings.
General descriptions and classifications are recovered research. Verified details above identify the specific checks we have completed. Check the creator’s current publication for later changes.