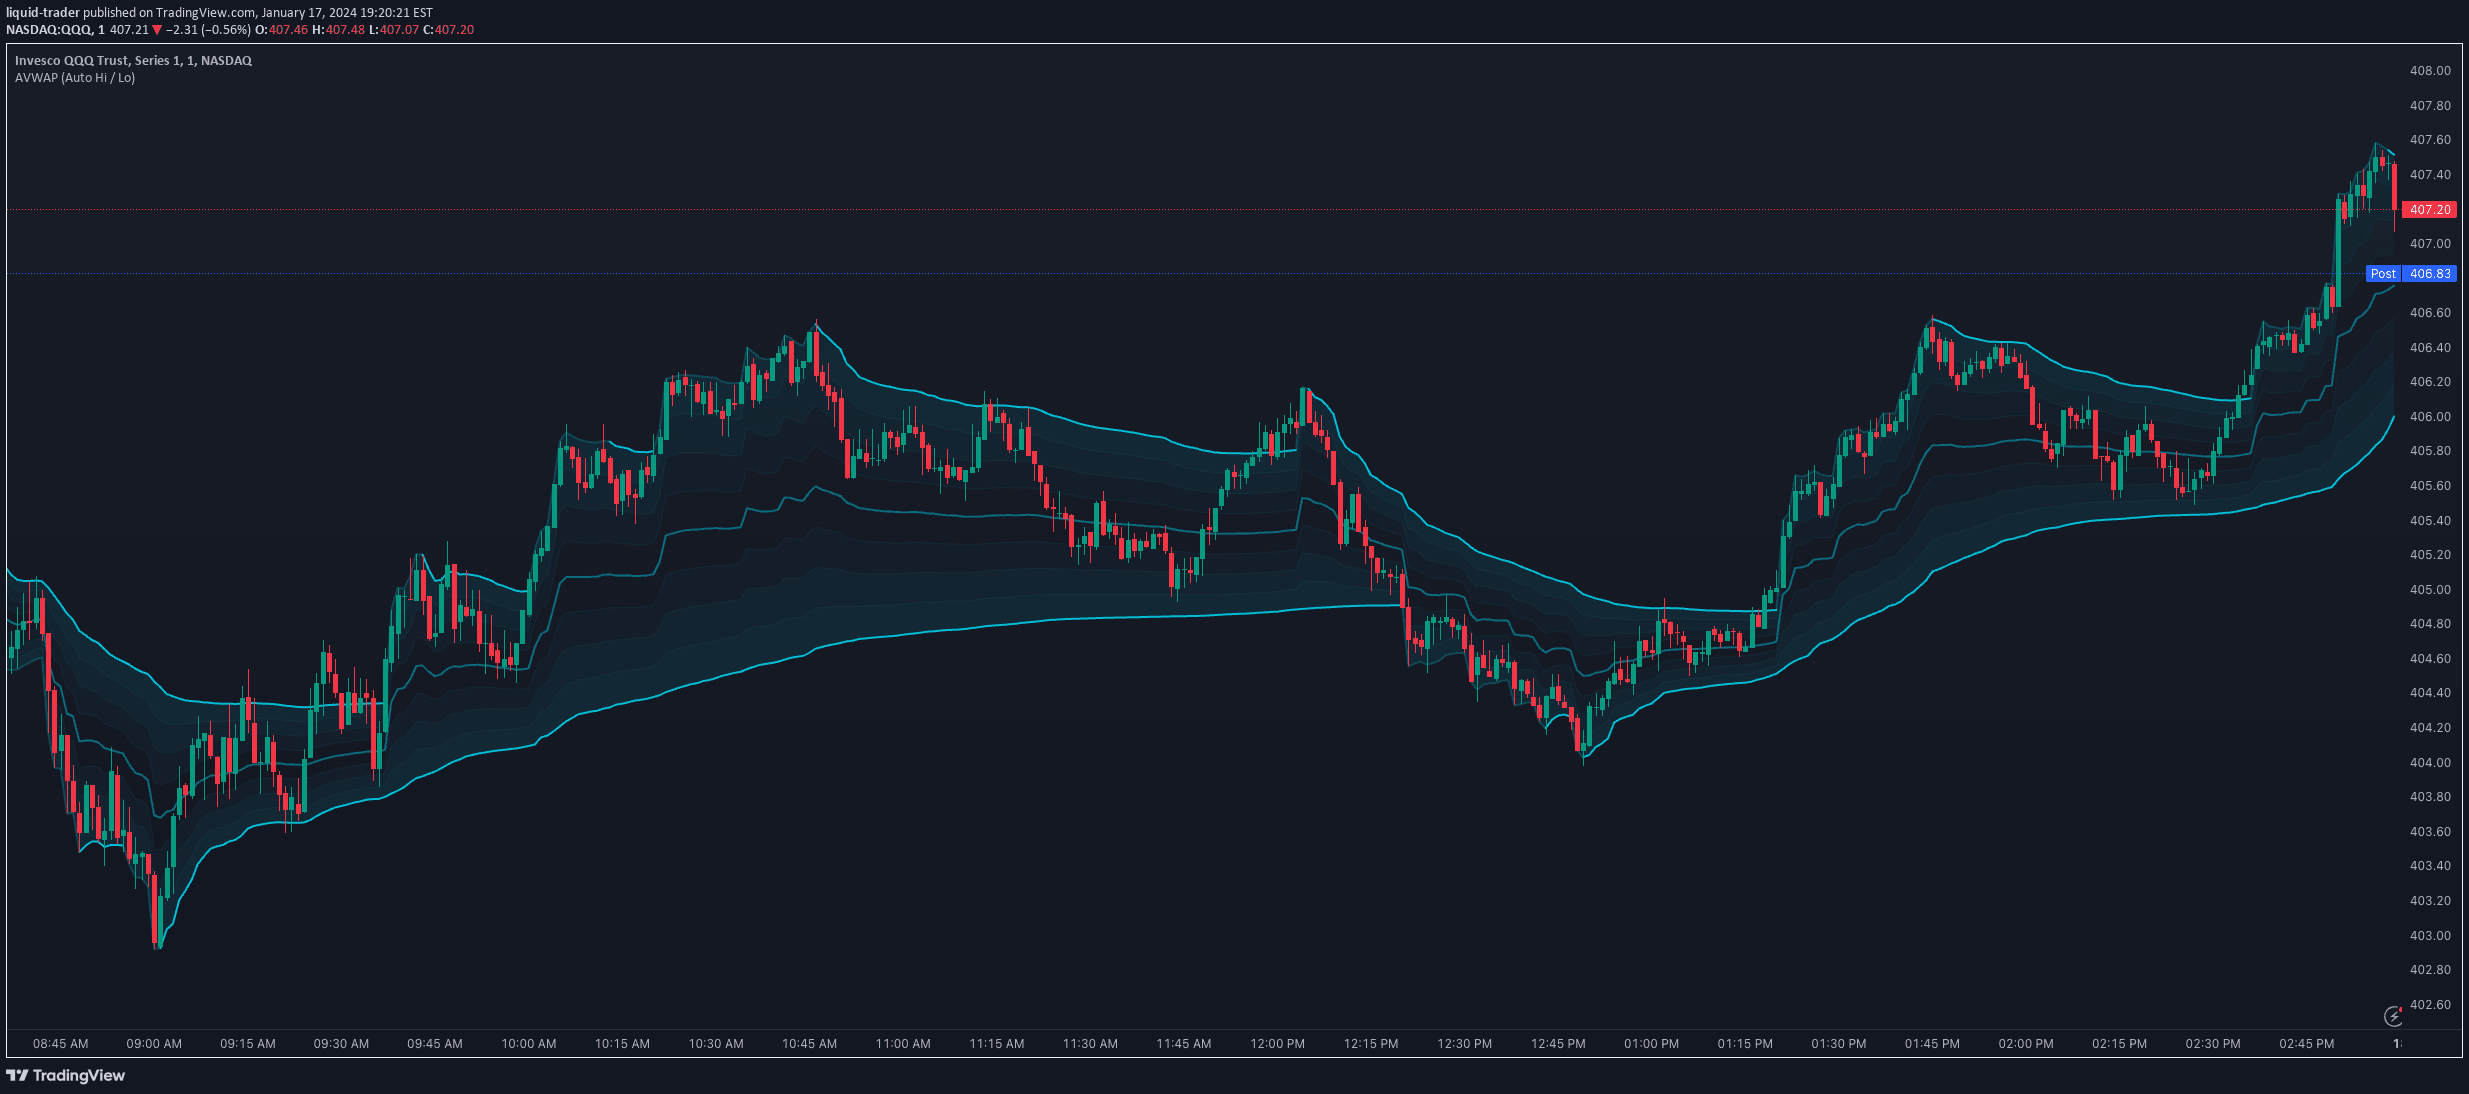
A VWAP indicator that automatically adapts to missing volume data by using a fallback TWAP calculation, providing consistent daily, weekly, and monthly price level insights.
Explore complementary indicator rolesHow it works
The Fallback VWAP script calculates Volume Weighted Average Price (VWAP) across daily, weekly, and monthly timeframes with standard deviation bands. When volume data is unavailable or zero, the script automatically switches to a Time Weighted Average Price (TWAP) approach by using a constant fallback volume of 1.
By utilizing the hlc3 (high-low-close average) as the price source, the indicator ensures consistent plotting even on instruments like indices that might not provide volume data. This adaptive approach maintains the integrity of the price level analysis regardless of volume constraints.
Why it may be useful
The Fallback VWAP provides traders with a reliable method to analyze price levels and trends across different timeframes, even when traditional volume data is incomplete. Its ability to seamlessly transition between VWAP and TWAP calculations ensures that traders always have a meaningful reference point for market analysis.
By offering color-coded trend information and standard deviation bands, the indicator helps traders quickly understand price positioning relative to key average levels. This flexibility makes it particularly valuable for analyzing indices and less liquid assets where volume data might be unreliable.
When to explore it
This indicator is most effective for traders analyzing indices, less liquid assets, or markets with inconsistent volume reporting. It works exceptionally well for intraday and swing trading strategies across multiple timeframes, providing a consistent method of price level analysis.
Traders can benefit from this tool when they need a robust method of understanding price positioning that isn't dependent on perfect volume data. It is particularly useful for identifying potential support and resistance levels, tracking price trends, and making informed trading decisions in challenging market conditions.
Keep exploring
What we’ve verified
Access, alerts and repainting behaviour have not been independently verified for this indicator. Check the creator’s current publication and settings.
General descriptions and classifications are recovered research. Verified details above identify the specific checks we have completed. Check the creator’s current publication for later changes.