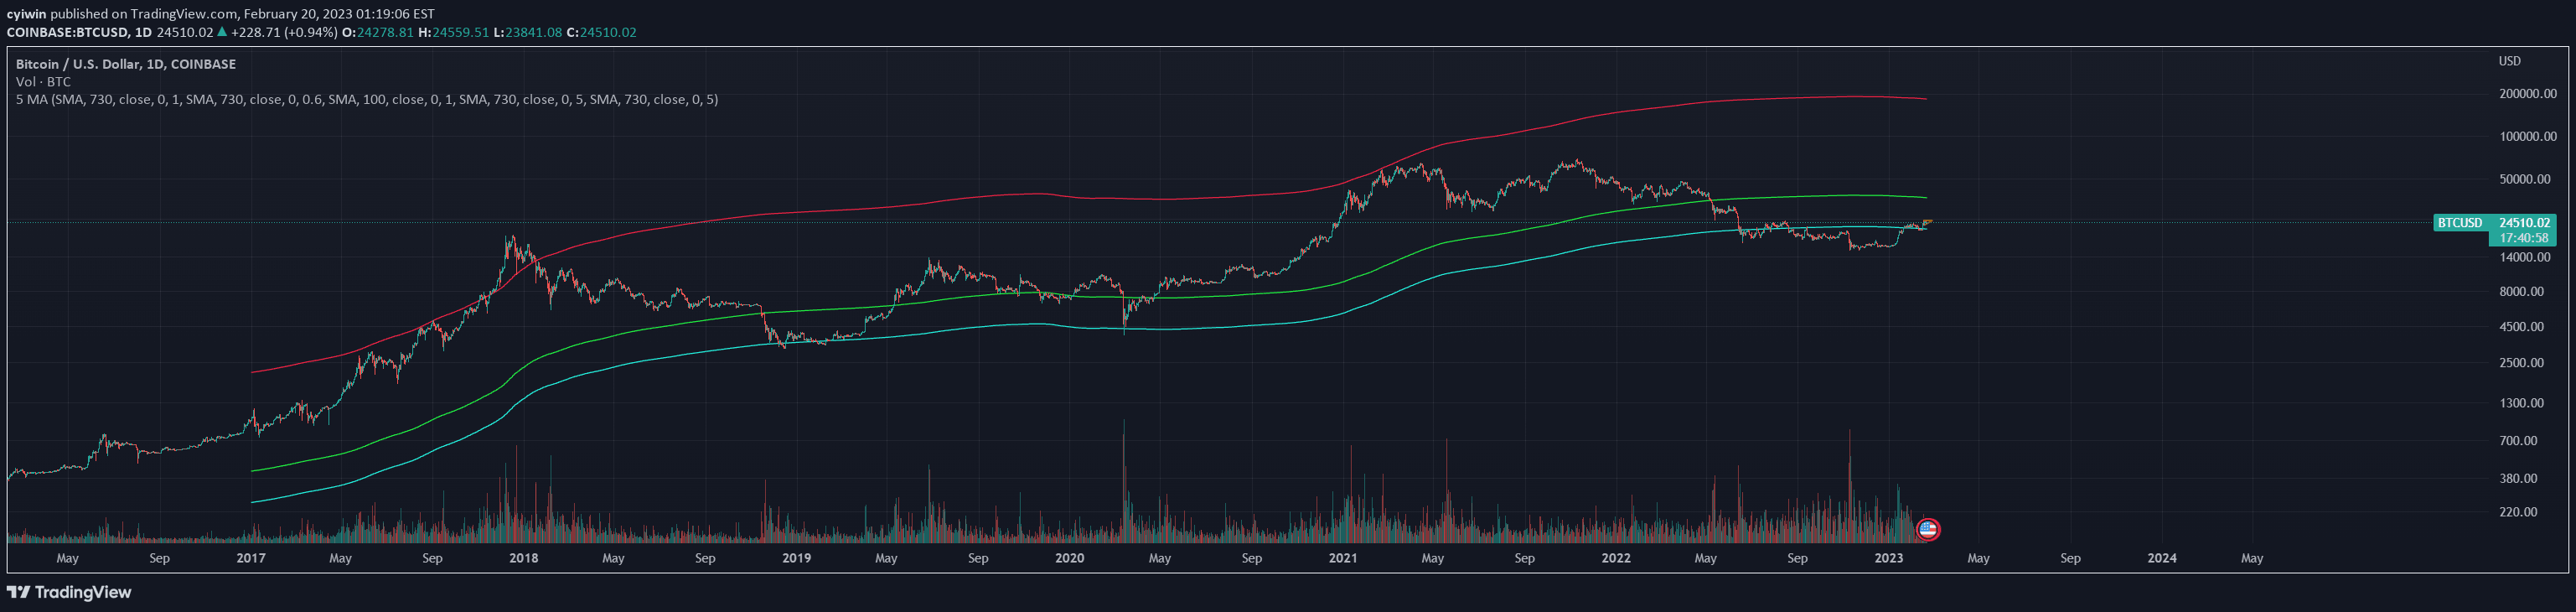
The Boosted Moving Average (BMA) enhances traditional EMA by introducing a boost factor that amplifies price change responsiveness and provides clearer market trend visualization.
Explore complementary indicator rolesHow it works
The Boosted Moving Average calculates two Exponential Moving Averages (EMAs) with different lengths, creating a divergence that forms the basis for boosted values. One EMA uses the full specified length, while the other uses half that length, allowing for more nuanced price movement detection.
The boost factor then amplifies the difference between these two EMAs, creating an enhanced signal that is more responsive to market changes. A final smoothing EMA is applied to refine the signal, ensuring clarity without over-complicating the visualization and providing traders with a clean, interpretable market trend indicator.
Why it may be useful
The Boosted Moving Average provides traders with a more dynamic and responsive trend analysis tool compared to traditional moving averages. By incorporating a boost factor, it allows for earlier detection of potential market shifts, enabling traders to make more timely and informed trading decisions.
The color-coded trend visualization makes it easy to quickly understand market direction, reducing cognitive load and helping traders rapidly assess the current market sentiment. Its ability to balance sensitivity with smoothing makes it a versatile tool for traders across different timeframes and trading styles.
When to explore it
The Boosted Moving Average is most effective in markets with clear trending characteristics, where price movements are more directional and less choppy. It performs particularly well in liquid markets with consistent volume, such as major forex pairs, large-cap stocks, and prominent cryptocurrency pairs.
Traders should be cautious when using this indicator in highly volatile or range-bound markets, where frequent price reversals might generate false signals. It is most reliable when used in conjunction with other technical indicators to confirm trend strength and potential entry or exit points.
Keep exploring
What we’ve verified
Access, alerts and repainting behaviour have not been independently verified for this indicator. Check the creator’s current publication and settings.
General descriptions and classifications are recovered research. Verified details above identify the specific checks we have completed. Check the creator’s current publication for later changes.