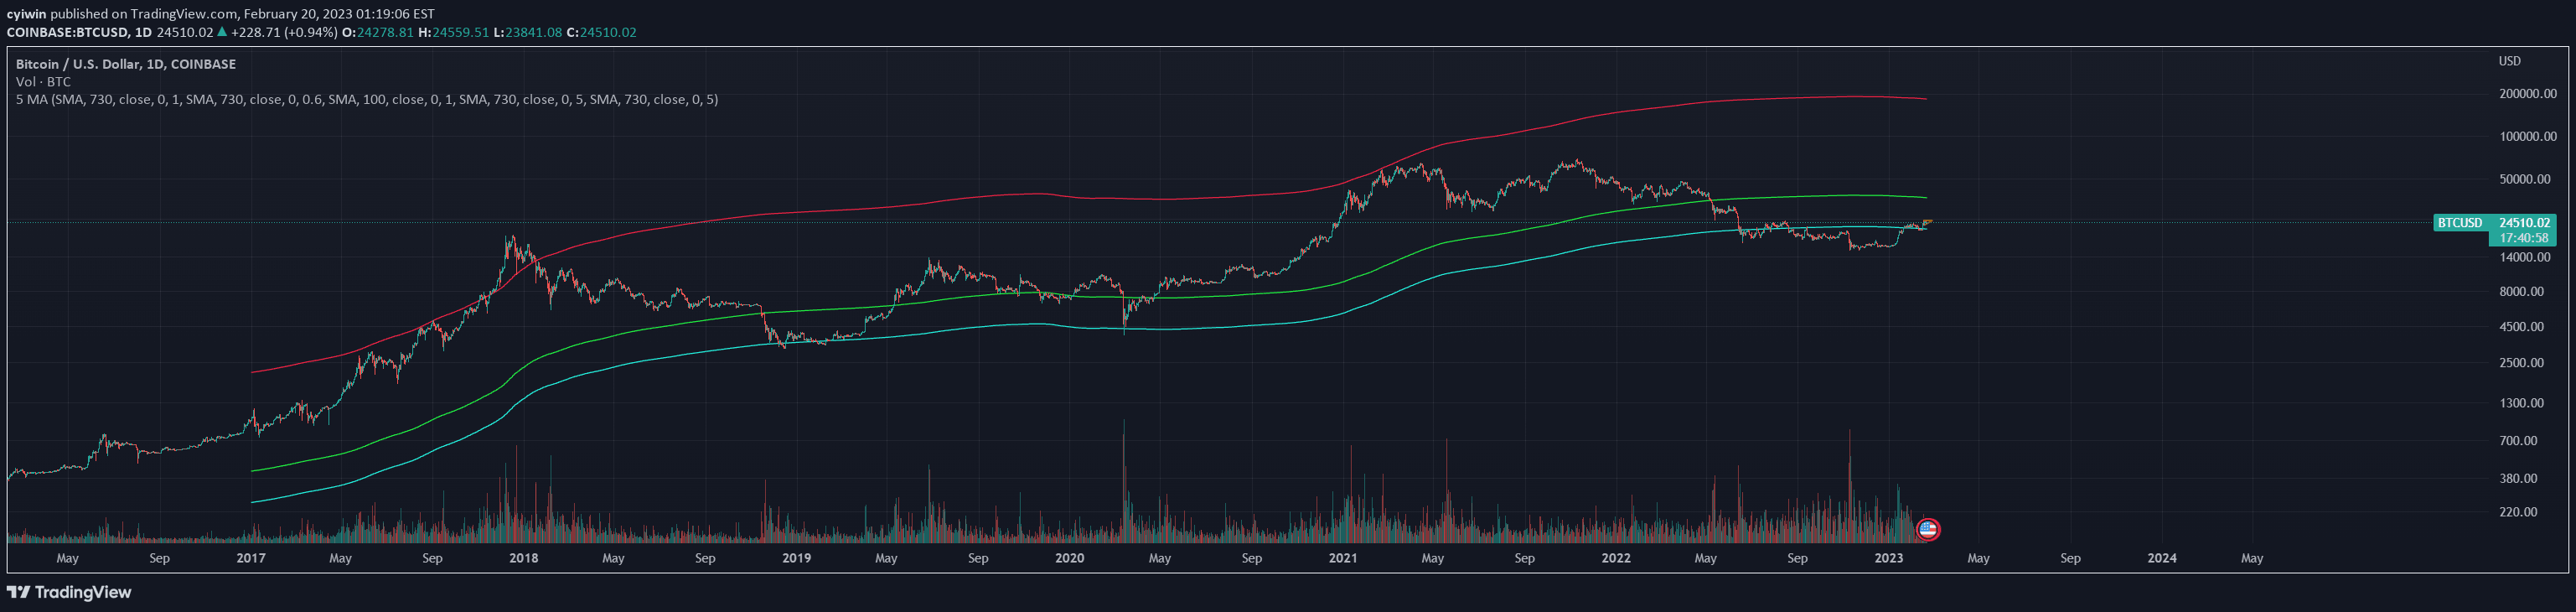
A comprehensive Moving Average toolkit that offers multiple MA visualization, dynamic ribbons, and customizable crossover alerts for identifying market trends and potential trading opportunities.
Explore complementary indicator rolesHow it works
The Decode Moving Average Toolkit operates by simultaneously displaying multiple Moving Averages (MAs) on a single chart, including both Exponential and Simple Moving Averages. Traders can configure up to 10 different MAs, adjusting their lengths and sources to match their specific trading strategy and market analysis preferences.
The toolkit creates dynamic MA ribbons between corresponding EMAs and SMAs, which change color to indicate bullish or bearish sentiment. Additionally, it provides customizable crossover alerts that can be set between any two selected MAs, with optional visual symbols displayed directly on the chart to highlight crossover points.
Why it may be useful
Moving Averages are crucial tools for understanding market trends, providing traders with a smoothed representation of price movement that helps filter out market noise and identify underlying directional momentum. By offering multiple MA types and visualization options, this toolkit allows traders to gain deeper insights into market dynamics and potential trend changes.
The comprehensive nature of the toolkit enables traders to customize their analysis, combining different MA lengths and types to create more robust and personalized trading strategies. The ability to set multiple alerts and visualize trends across different timeframes makes it an powerful tool for traders seeking to make more informed and data-driven trading decisions.
When to explore it
The Decode Moving Average Toolkit is most effective in trending markets where price shows clear directional movement, either upward or downward. Traders can utilize longer-term MAs like 50, 100, and 200-period averages to identify overall market trends, while shorter-term MAs can help pinpoint potential entry and exit points.
The toolkit is particularly useful when conducting multi-timeframe analysis, allowing traders to confirm signals across different chart intervals. It works best when combined with other technical indicators like RSI or MACD, providing additional confirmation and increasing the probability of successful trade setups.
Keep exploring
What we’ve verified
Access, alerts and repainting behaviour have not been independently verified for this indicator. Check the creator’s current publication and settings.
General descriptions and classifications are recovered research. Verified details above identify the specific checks we have completed. Check the creator’s current publication for later changes.