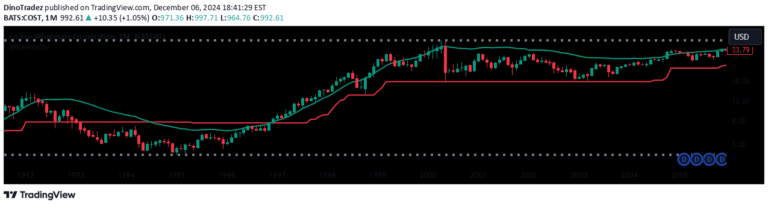
An average session range indicator that measures market volatility across different trading sessions, helping traders understand potential price fluctuation zones and intraday reversals.
Explore complementary indicator rolesHow it works
The indicator calculates the trading session ranges for Asia, London, and New York markets by measuring price movements within specific time periods. It uses a configurable lookback period to determine the average session range (ASR), which provides upper and lower price fluctuation bounds.
The script allows customization of UTC settings to accurately measure ranges for different market sessions. By averaging past session ranges, it generates a statistical representation of potential price movement zones
Why it may be useful
This volatility indicator helps traders understand market dynamics by quantifying expected price ranges during different trading sessions. It provides crucial insights into potential price fluctuations, which can inform risk management and trade entry/exit strategies.
By revealing typical market movement patterns, traders can make more informed decisions about position sizing, stop-loss placement, and potential reversal points. The adaptable nature of the indicator makes it versatile across various financial instruments
When to explore it
The average session range indicator is most effective during active trading sessions with significant market participation. It works best in forex markets but can be applied to other assets with clear trading sessions.
Traders should use this indicator when seeking to understand market volatility, identify potential reversal zones, and gauge expected price ranges. It is particularly useful during periods of market uncertainty or when transitioning between different global trading sessions
Keep exploring
What we’ve verified
Access, alerts and repainting behaviour have not been independently verified for this indicator. Check the creator’s current publication and settings.
General descriptions and classifications are recovered research. Verified details above identify the specific checks we have completed. Check the creator’s current publication for later changes.