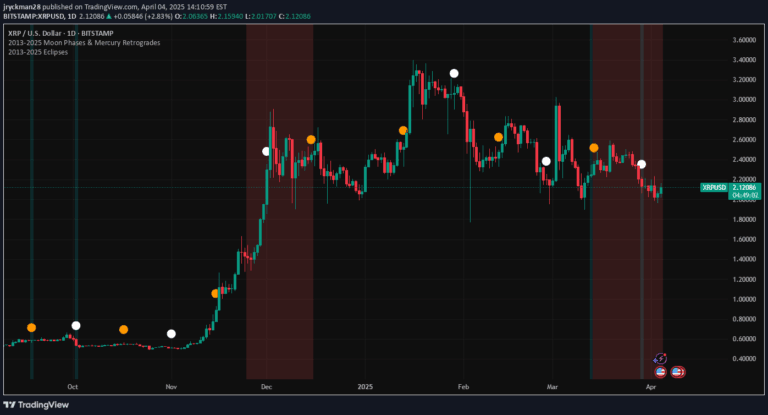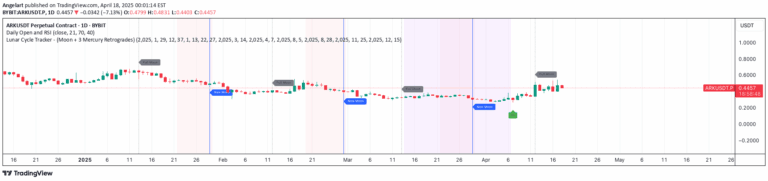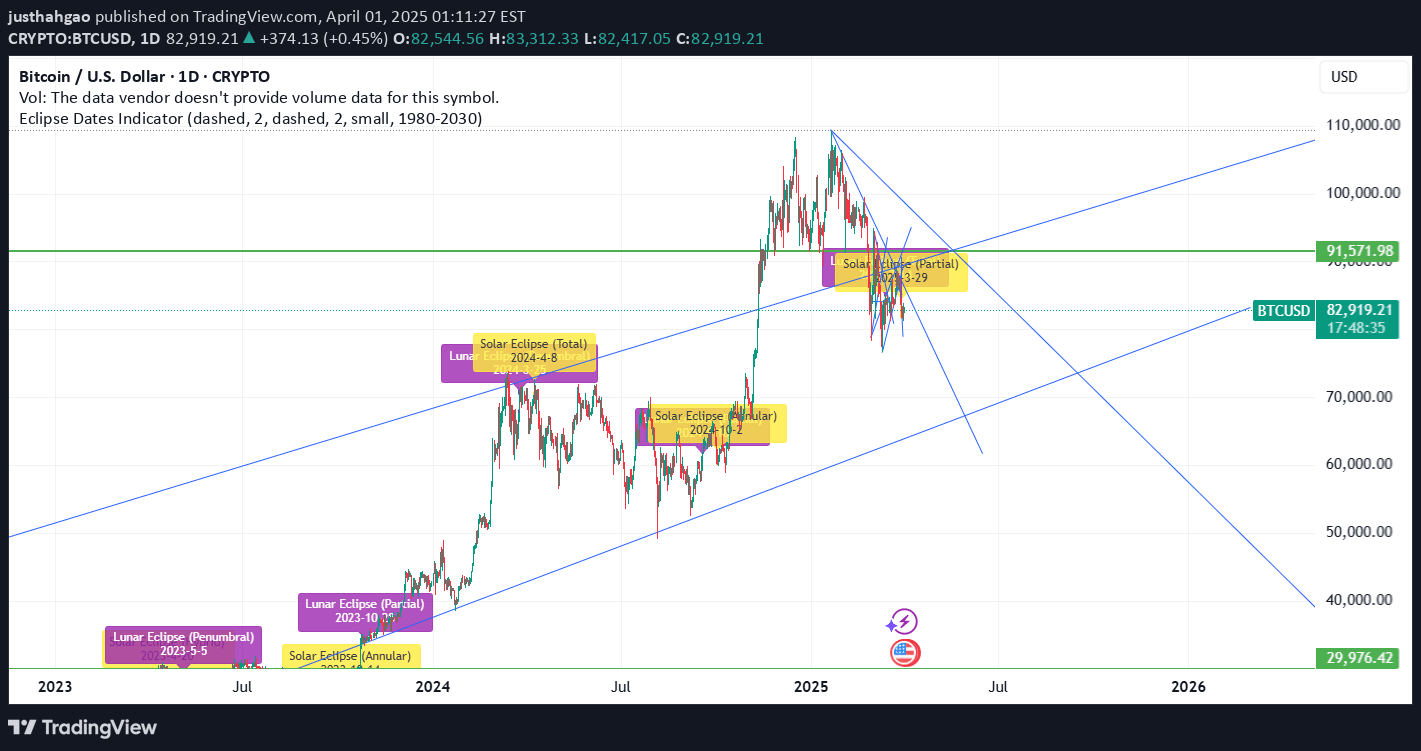
A TradingView indicator that plots vertical lines for solar and lunar eclipses between 1980-2030, offering comprehensive customization of eclipse type, visualization, and filtering options.
Explore complementary indicator rolesHow it works
The Eclipse Indicator analyzes NASA's Five Millennium Catalog of Solar Eclipses to identify and plot eclipse events between 1980 and 2030. Traders can filter eclipses by type (solar/lunar) and subtype (total, partial, annular, penumbral, hybrid).
The indicator generates vertical lines on the chart representing specific eclipse dates. Users can customize line colors, styles, and widths for solar and lunar eclipses. Additional settings include label visibility, size, and chart border extension, allowing traders to create a tailored visual representation of eclipse events
Why it may be useful
Eclipse indicators provide unique astronomical insights that can correlate with market behavior and psychological trading patterns. By visualizing significant celestial events, traders can observe potential market sentiment shifts or cyclical patterns.
The comprehensive filtering options allow for detailed analysis of eclipse occurrences across different decades. Customizable visual settings enable traders to integrate eclipse data seamlessly into their existing chart analysis. This tool bridges astronomical events with financial market observations, offering a novel perspective on market dynamics
When to explore it
This Eclipse Indicator is most effective for traders interested in long-term market analysis and potential correlations between astronomical events and financial markets. It works best on daily or weekly timeframes to provide clear visibility of eclipse dates.
Traders can use this tool to explore potential cyclical patterns, research market behavior during significant astronomical events, and enhance their strategic planning. The indicator is particularly useful for academic researchers, quantitative analysts, and traders seeking unconventional market insights
Keep exploring
What we’ve verified
Access, alerts and repainting behaviour have not been independently verified for this indicator. Check the creator’s current publication and settings.
General descriptions and classifications are recovered research. Verified details above identify the specific checks we have completed. Check the creator’s current publication for later changes.