
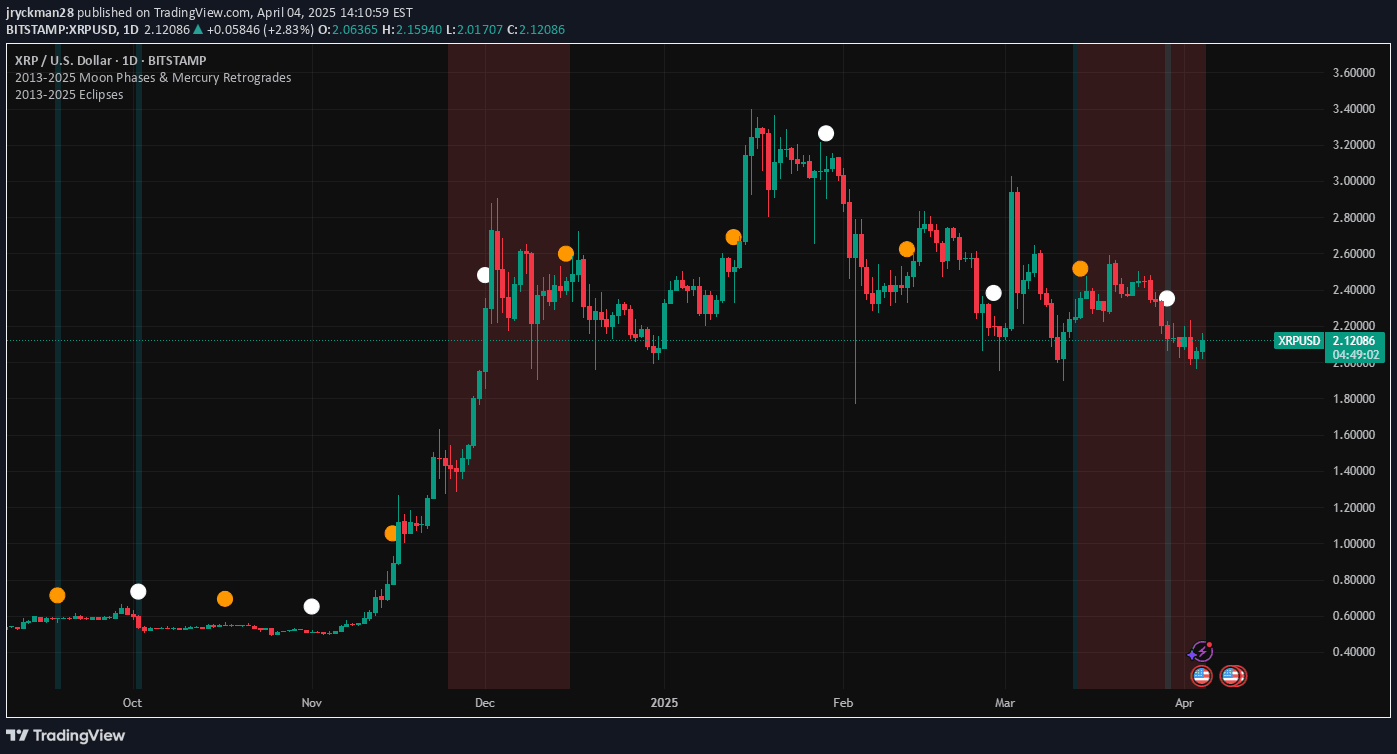
An eclipse tracking indicator that highlights significant astronomical dates on TradingView charts, allowing traders to visualize potential market turning points during eclipse events from 2013 to 2025.
Explore complementary indicator rolesHow it works
The indicator uses a predefined list of 48 specific eclipse dates between 2013 and 2025. It checks the current chart date against these predefined dates using a helper function is_date(). When a match is found, the script applies a semi-transparent aqua background highlight to the specific date.
The background uses color.new(color.aqua, 85) to maintain price visibility while emphasizing the eclipse date. The script works on any TradingView timeframe but is most effective on daily or higher timeframes
Why it may be useful
Eclipse events are considered significant in astrological analysis, potentially representing moments of sudden change or market sentiment shifts. By visually highlighting these dates, traders can identify potential correlation between astronomical events and market movements.
The indicator provides a unique perspective for traders interested in combining celestial observations with technical analysis. It offers a simple, non-intrusive method to track eclipse dates across a 12-year period directly on the price chart
When to explore it
This indicator is most useful for traders who incorporate astrological insights into their market analysis. It works best on daily, weekly, or monthly charts where individual dates are clearly visible.
Traders interested in long-term market psychology, cyclical patterns, or alternative analysis methods will find this tool valuable. It can be particularly interesting during periods of market uncertainty or when seeking additional context for potential trend reversals
Keep exploring
What we’ve verified
Access, alerts and repainting behaviour have not been independently verified for this indicator. Check the creator’s current publication and settings.
General descriptions and classifications are recovered research. Verified details above identify the specific checks we have completed. Check the creator’s current publication for later changes.


