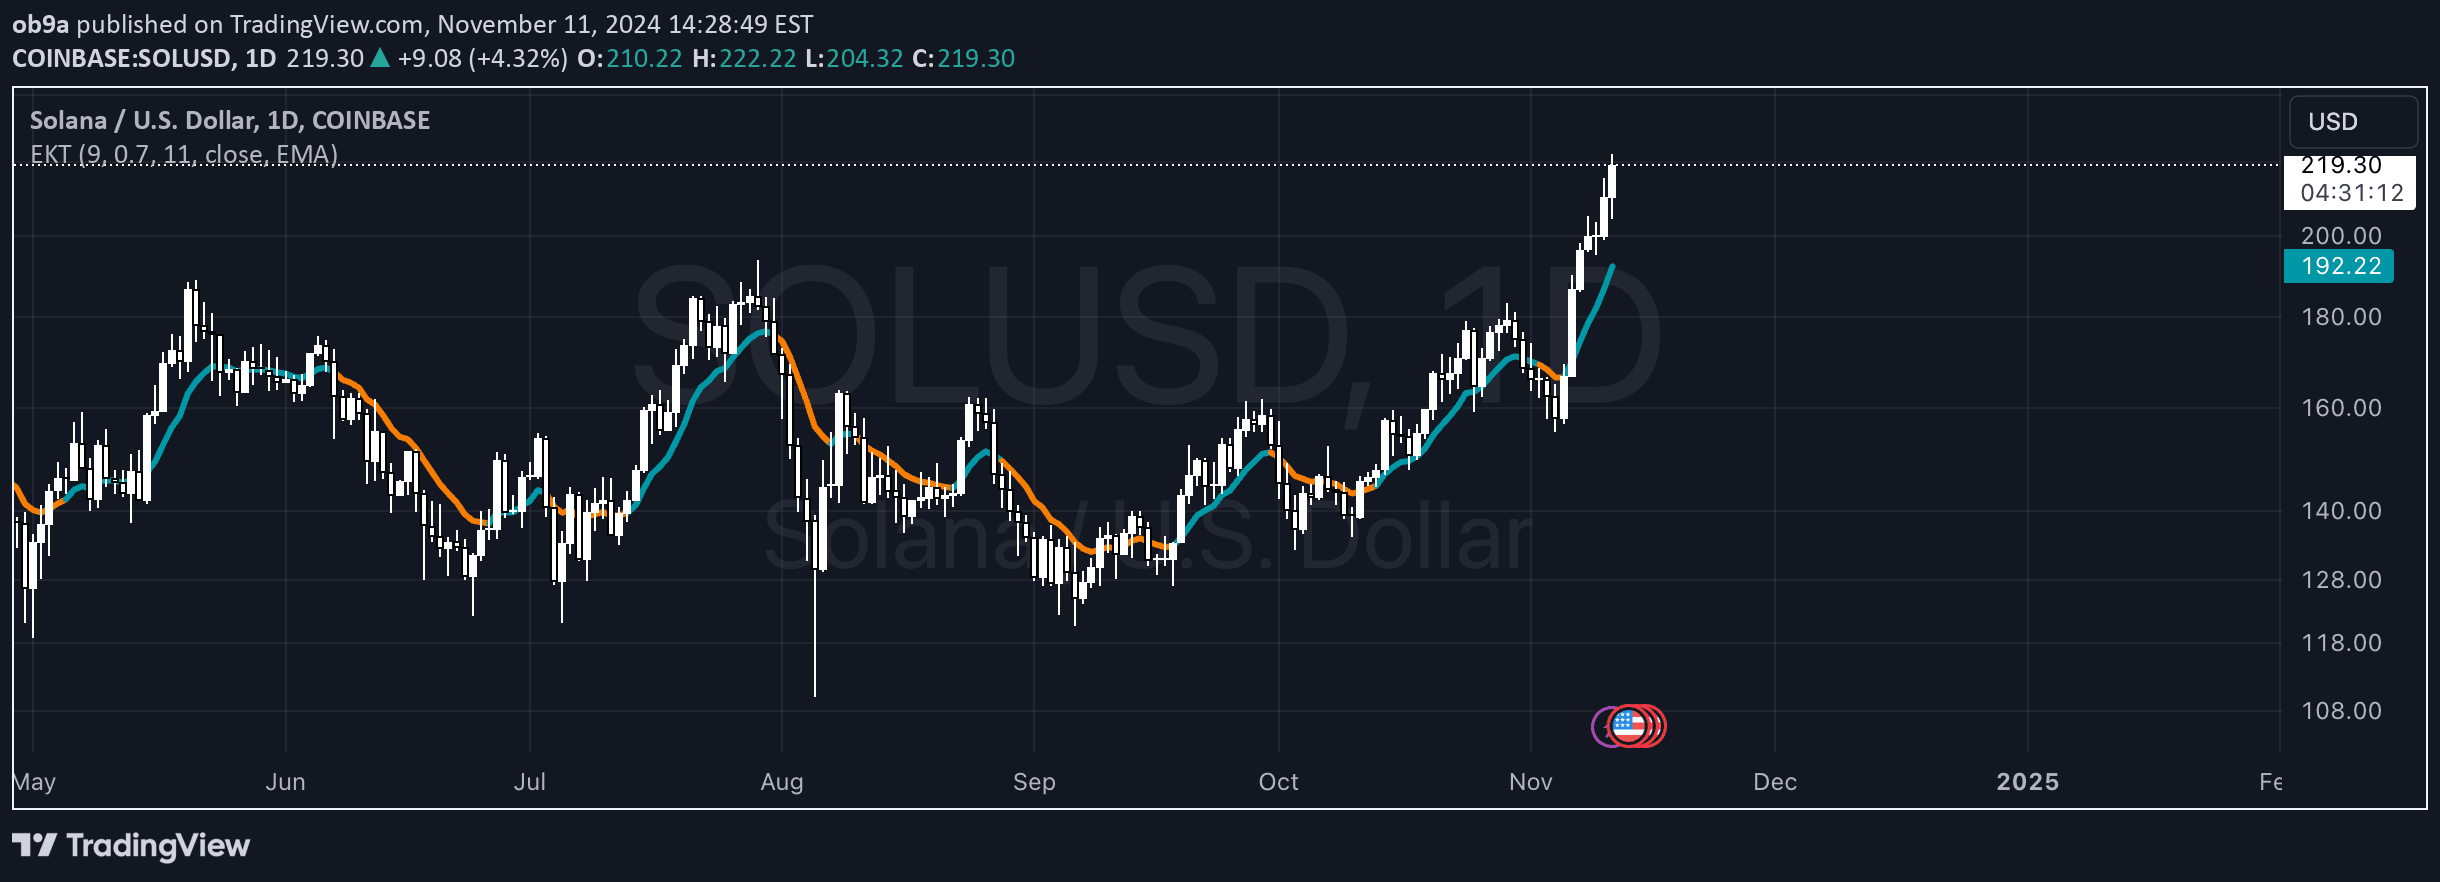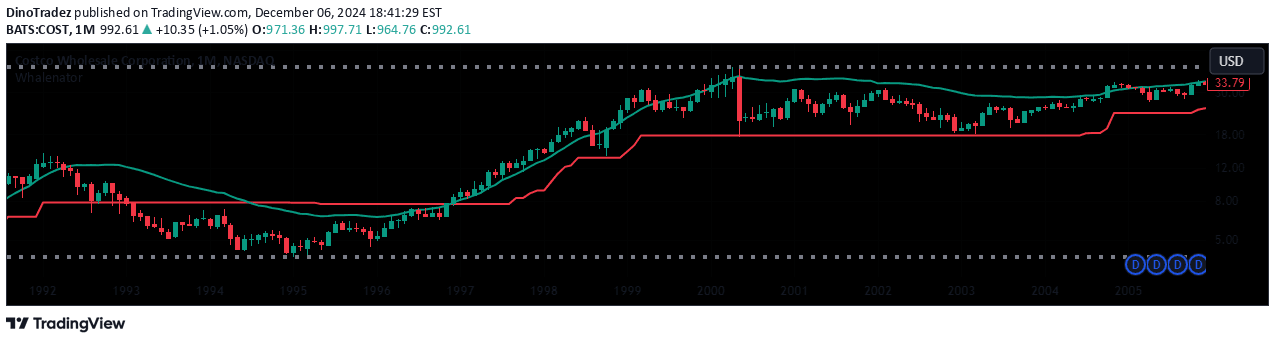
A comprehensive multi-dimensional trading indicator combining trend analysis, volatility channels, volume profile, and institutional activity detection to provide holistic market insights.
Explore complementary indicator rolesHow it works
The indicator uses multiple analytical techniques to generate comprehensive market insights. It starts with a SuperTrend-like line that adapts to market conditions using Average True Range (ATR), providing dynamic trend direction by comparing price to trailing stop levels.
Additionally, the indicator incorporates Keltner Channels to visualize price volatility and creates dynamic order blocks by detecting significant volume and pivot points. It tracks volume profile, estimates bid/ask volume distribution, and identifies 'whale' activities by highlighting bars with exceptionally large trading volumes.
Why it may be useful
This integrated indicator offers traders a multifaceted view of market dynamics by combining trend, volatility, and volume analysis in a single tool. It helps traders understand market structure, institutional participation, and potential price reaction zones without switching between multiple indicators.
By providing insights into trend direction, volatility levels, and volume characteristics, the indicator enables more informed decision-making. Traders can quickly assess market conditions, identify potential support and resistance levels, and gain a deeper understanding of price action and market sentiment.
When to explore it
The indicator is most effective in markets with clear directional movements and significant volume activity. It performs well in liquid markets like major forex pairs, stock indices, and high-volume cryptocurrency trading pairs where volume data provides meaningful insights.
Traders should use this tool during periods of moderate to high market volatility, when institutional participation is likely to be significant. It is particularly useful for identifying potential trend reversals, confirming existing trends, and understanding the underlying market structure across different timeframes.
Keep exploring
What we’ve verified
Access, alerts and repainting behaviour have not been independently verified for this indicator. Check the creator’s current publication and settings.
General descriptions and classifications are recovered research. Verified details above identify the specific checks we have completed. Check the creator’s current publication for later changes.