The Next Pivot [Kioseff Trading]
A trading signal that finds the most similar historical price sequences and projects future price movements using multiple similarity and correlation measures.
Explore 11,183 indicators. Filter beyond the obvious.
Discover the tools that fit the way you trade.
11,183 tools to explore
A trading signal that finds the most similar historical price sequences and projects future price movements using multiple similarity and correlation measures.
Advanced machine learning trading tool using kernel regression to predict price targets and trends. Provides dynamic analysis with customizable settings for enhanced trading decision-making.
Advanced machine learning trading strategy utilizing signal processing techniques and custom moving averages to generate precise housing market trading signals and performance metrics.
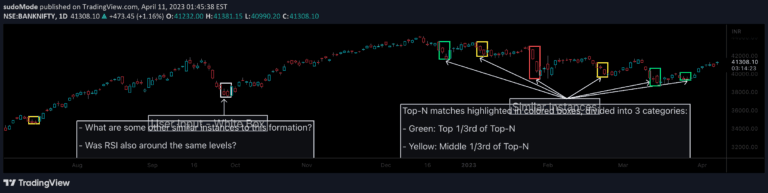
A pattern recognition tool that analyzes price chart similarities by computing vector-based similarities across multiple candle dimensions, highlighting potential matching historical patterns.
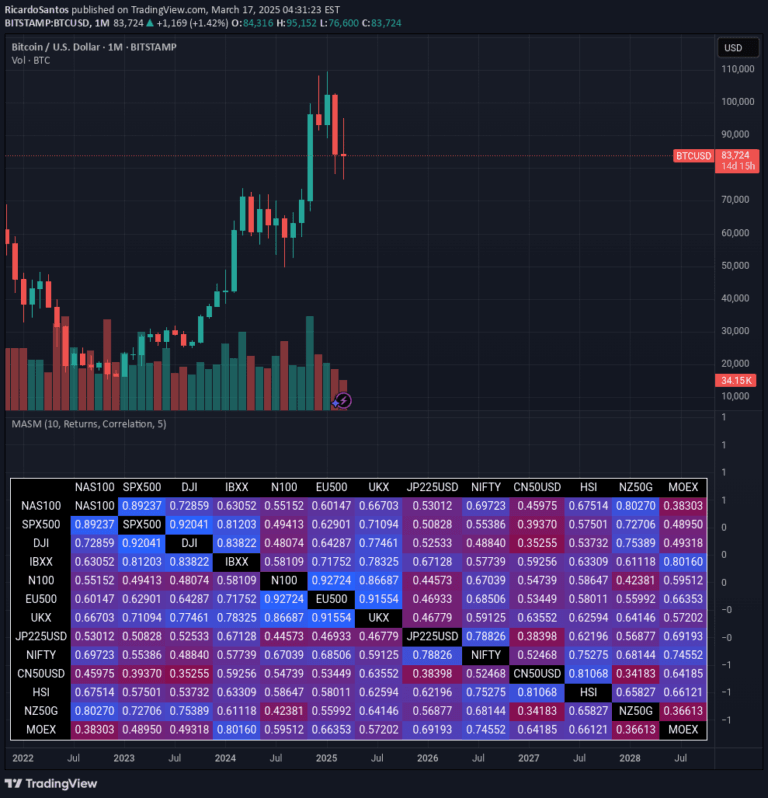
A market analysis tool that calculates and visualizes asset similarities using advanced mathematical measures, revealing complex relationships between different market indices through color-coded correlation metrics.
A sophisticated trading indicator that finds historically similar price sequences and projects potential future price movements using advanced correlation and similarity measures across multiple timeframes.
A k-nearest neighbors (k-NN) model that predicts stock prices by comparing current market conditions with historical data points using distance calculations and price estimation.
Kmean with Standard Deviation Channel combines clustering algorithm and statistical measure to analyze price trends, identify support/resistance levels, and assess market volatility.
A predictive trading indicator using Euclidean distance to identify similar historical candle patterns and forecast potential next-day price movements by analyzing candle formations and statistical probabilities.
A sophisticated trading signal using Lorentzian geometry to analyze market patterns by measuring complex similarities between historical market states and current conditions.
A sophisticated VWAP indicator that calculates volume-weighted average price with multiple standard deviation bands, helping traders identify dynamic support and resistance levels.
A pseudo Random Forest classification algorithm that uses decision matrices to predict potential breakouts or trend movements using two independent variables like RSI and Z-Score.
Likes, views, and comments are historical TradingView snapshots. They describe attention, not trading performance.