YOUR INDICATOR RESEARCH STARTS HERE

Find the right indicator.
Understand what it does.

Explore 11,183 indicators. Filter beyond the obvious.
Discover the tools that fit the way you trade.

THE INDICATOR LIBRARY

Results for “history”

11,183 tools to explore

99 indicators matching your filters
Save search
TrendEditor’s pick

SuperTrend AI (Clustering) [LuxAlgo]

by LuxAlgo

SuperTrend AI is an advanced machine learning technique that applies K-means clustering to the SuperTrend indicator, dynamically adapting trailing stop settings based on performance metrics.

Main price chart · unverifiedDay Trading · Swing Trading
Explore
17.8Klikes586.2Kviews155comments
Save
TrendSignalLevels

Pivot Point Profile [LuxAlgo]

by LuxAlgo

A pivot point profile indicator that groups and displays data from previous swing highs and lows, helping traders identify potential support and resistance zones.

Main price chart · unverifiedScalping · Day Trading
Explore
1.7Klikes35.1Kviews4comments
Save
MomentumVolume

Deep Volume [ChartPrime]

by ChartPrime

Deep Volume provides high-fidelity volume analysis using real-time Tradingview data, offering detailed insights into market dynamics through comprehensive volume metrics and visualization.

Separate pane · unverifiedScalping · Day Trading
Explore
1.5Klikes31.8Kviews4comments
Save
TrendVolatilityEditor’s pick

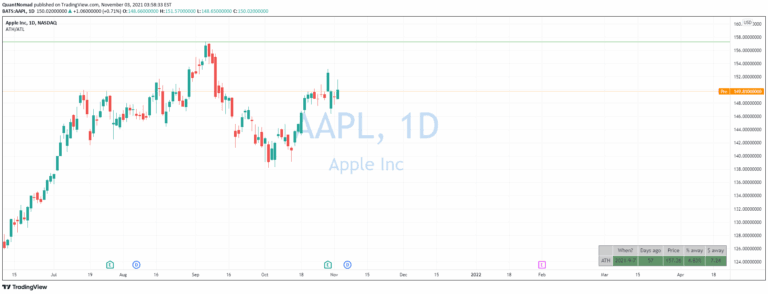
All-Time High/Low Widget

by QuantNomad

A widget that tracks all-time high and all-time low price levels, providing traders with insights into historical price extremes and potential breakout opportunities.

Main price chart · unverifiedDay Trading · Swing Trading
Explore
1Klikes45.4Kviews26comments
Save
TrendLevels

Ripster MTF Clouds

by ripster47

MTF EMA Cloud is a multi-timeframe trading system using exponential moving averages to identify trend, support, and resistance levels across different timeframes.

Main price chart · unverifiedDay Trading · Swing Trading
Explore
944likes14.7Kviews4comments
Save
TrendVolatilityEditor’s pick

Earnings Price Move Cheat Sheet [KT]

by KioseffTrading

An advanced earnings analysis tool that calculates price performance before and after earnings releases, measuring potential correlations, price variations, and risk metrics for trading decisions.

Separate pane · unverifiedSwing Trading
Explore
819likes36.9Kviews16comments
Save

Likes, views, and comments are historical TradingView snapshots. They describe attention, not trading performance.

START WITH A QUESTION

A little less searching.
A lot more understanding.

Tell DeepAlpha what you need. Get an explanation, a shortlist,
and a direct path to the indicators behind it.

Ask DeepAlpha