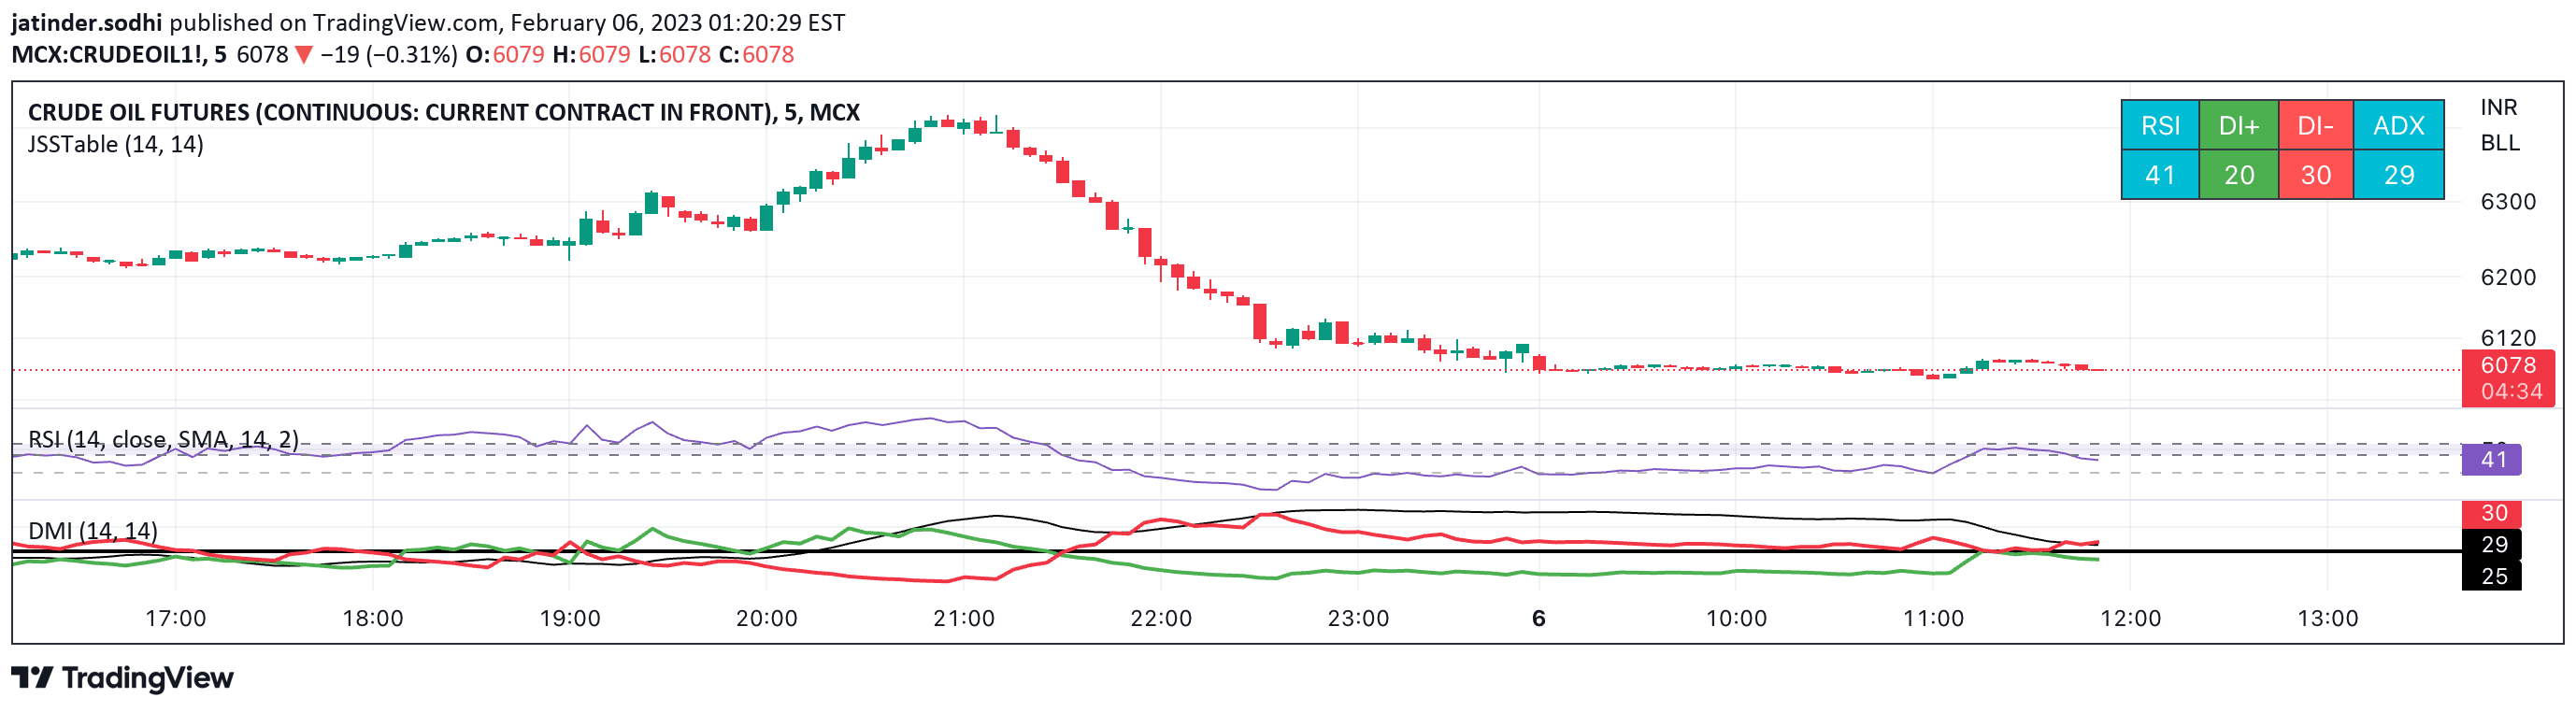
RSI Past is a custom trading signal that tracks the directional momentum of a stock by comparing the number of bars since recent overbought and oversold RSI conditions.
Explore complementary indicator rolesHow it works
The RSI Past indicator compares the bars passed since recent overbought and oversold RSI conditions. It calculates a simple difference between these two time periods, creating a unique momentum measurement. Positive readings indicate bullish momentum, with the score increasing each time RSI hits an overbought condition.
Conversely, negative readings suggest bearish momentum, growing more negative as oversold conditions occur. The signal provides a dynamic view of a stock's recent price behavior beyond traditional RSI interpretation. It tracks the frequency and recency of overbought and oversold states to gauge potential trend direction
Why it may be useful
This signal offers traders an alternative perspective on market momentum by highlighting recent price action patterns. It helps identify potential trend continuations or reversals by tracking the stock's oscillation between overbought and oversold conditions.
The indicator can reveal underlying market sentiment and provide insights into potential future price movements. By quantifying the frequency of extreme RSI conditions, traders can gain a more nuanced understanding of a stock's recent performance. The signal can be particularly useful for identifying stocks with consistent bullish or bearish momentum
When to explore it
RSI Past works best in trending markets with clear directional movement. It is most effective when analyzing stocks that demonstrate consistent momentum in either bullish or bearish directions. Traders should use this signal alongside other technical indicators to confirm potential trade signals.
The indicator can be particularly valuable when examining stocks in sectors experiencing significant market trends. It is most reliable when used on liquid, actively traded stocks with sufficient price history. Combining RSI Past with volume and trend indicators can provide more comprehensive market analysis
Keep exploring
What we’ve verified
Access, alerts and repainting behaviour have not been independently verified for this indicator. Check the creator’s current publication and settings.
General descriptions and classifications are recovered research. Verified details above identify the specific checks we have completed. Check the creator’s current publication for later changes.