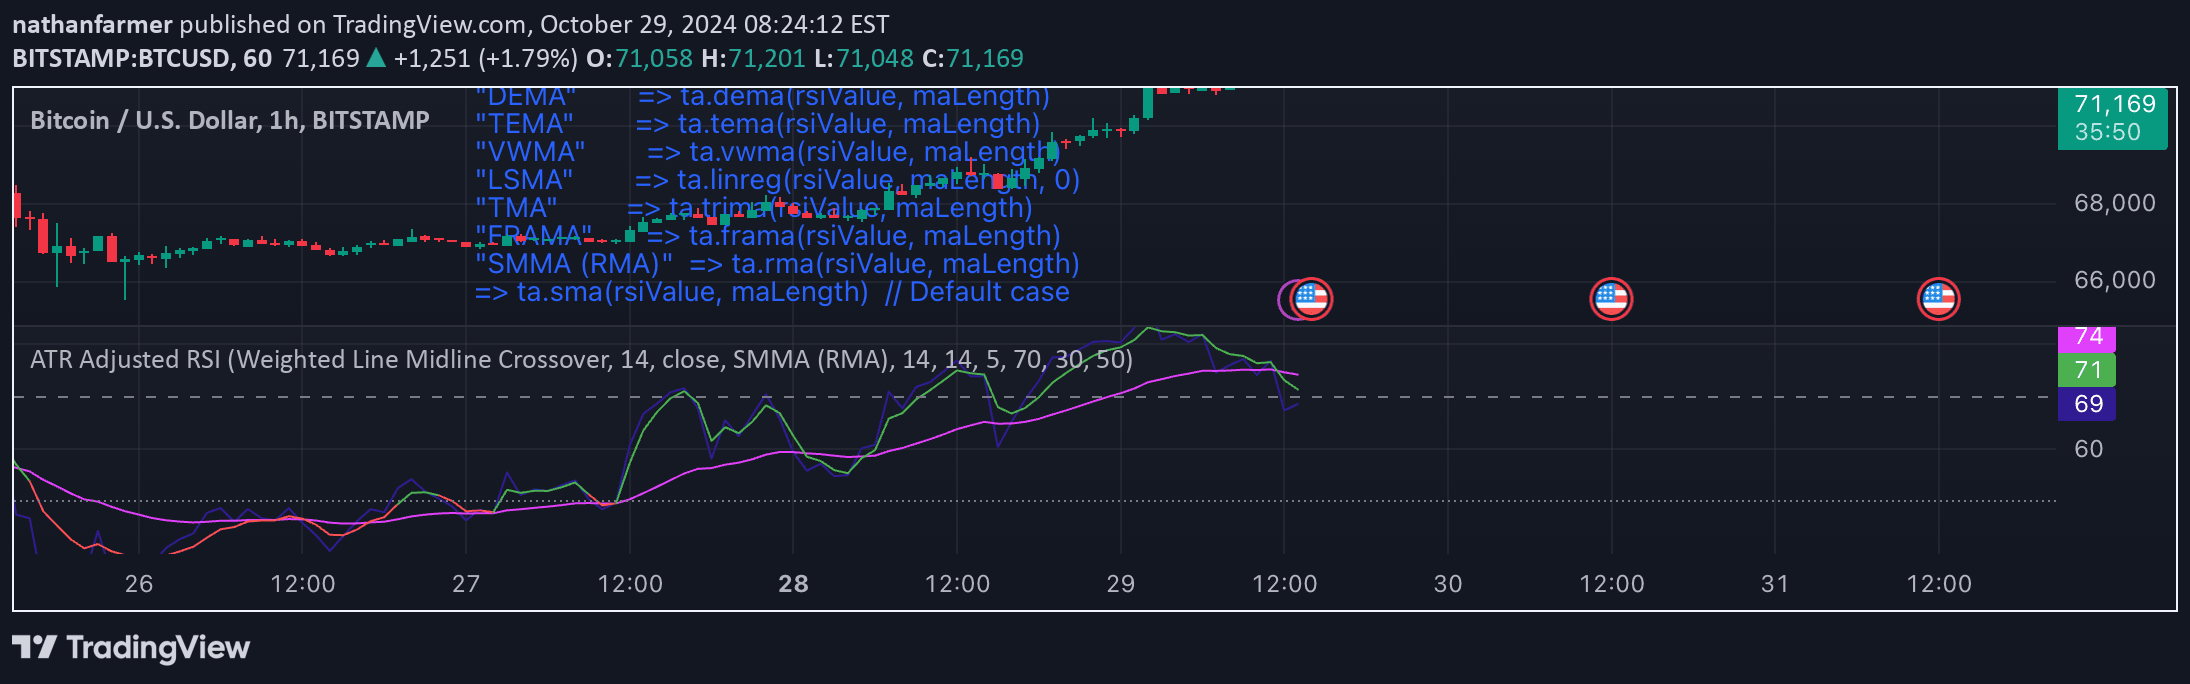
Color Coded RSI is an enhanced momentum indicator that dynamically colors price bars based on RSI values, providing visual insights into market overbought and oversold conditions.
Explore complementary indicator rolesHow it works
The Color Coded RSI modifies the standard Relative Strength Index by applying color coding directly to price bars based on their RSI values. When the RSI rises above 70, bars turn red or orange, signaling potential overbought conditions, while bars turning blue indicate RSI values below 30, suggesting oversold levels.
Gray or green bars around the 50 RSI level represent neutral market conditions. The color-coding mechanism provides traders with an immediate visual representation of momentum, allowing quick identification of potential trend reversals or continuation patterns without constantly referencing a separate oscillator panel.
Why it may be useful
The Color Coded RSI simplifies momentum analysis by transforming complex numerical data into an intuitive visual format. By color-coding price bars, traders can quickly assess market sentiment and potential trend shifts without performing complex calculations or switching between multiple chart views.
This approach reduces cognitive load and enables faster decision-making, particularly in fast-moving markets where split-second interpretations can significantly impact trading outcomes. The visual representation makes momentum analysis more accessible to traders of all experience levels.
When to explore it
The Color Coded RSI works best in trending and range-bound markets where momentum oscillations are pronounced. In strongly trending markets, color changes can help confirm trend strength and potential reversal points, providing valuable entry and exit signals for traders seeking to maximize their trading opportunities.
During periods of market consolidation, the indicator's color shifts can help identify subtle momentum changes before significant price movements occur. Traders should combine this tool with other technical indicators and fundamental analysis to validate signals and reduce false positive interpretations.
Keep exploring
What we’ve verified
Access, alerts and repainting behaviour have not been independently verified for this indicator. Check the creator’s current publication and settings.
General descriptions and classifications are recovered research. Verified details above identify the specific checks we have completed. Check the creator’s current publication for later changes.