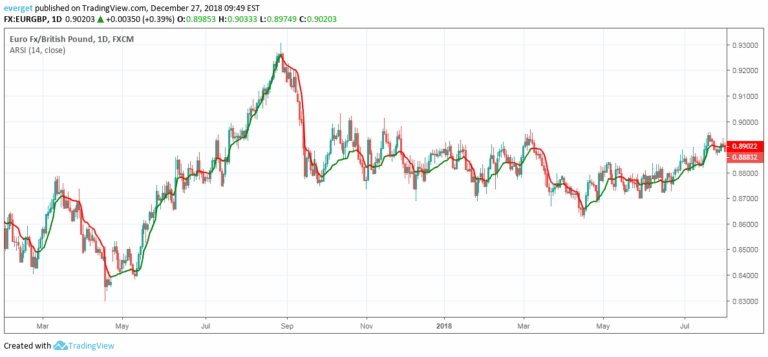
Advanced RSI indicator that enhances traditional momentum analysis by incorporating multiple moving averages and dynamic color-coding to provide deeper insights into market trends and potential reversals.
Explore complementary indicator rolesHow it works
The ADV_RSI calculates the Relative Strength Index using a customizable period, tracking price momentum by measuring the magnitude of recent price changes. It plots the RSI line alongside two moving averages (21 and 50 periods) to provide a more comprehensive view of market dynamics.
The indicator uses a dynamic color-coding system that changes the RSI line's color based on its current value, making it easier to interpret market conditions at a glance. Horizontal threshold lines at key levels (20, 30, 40, 50, 60, 70, 80) help traders quickly identify overbought and oversold zones.
Why it may be useful
The ADV_RSI provides traders with a more nuanced understanding of market momentum by offering multiple layers of analysis beyond the traditional RSI. Its advanced visualization helps traders quickly assess market conditions, reducing the complexity of interpreting raw price data and potential trend reversals.
By incorporating multiple moving averages and a color-coded system, the indicator offers a more comprehensive view of market dynamics. This approach helps traders make more informed decisions by providing visual cues about potential buying or selling opportunities based on momentum and trend strength.
When to explore it
The ADV_RSI is most effective in markets with clear trending or ranging conditions, where momentum signals can provide reliable insights into potential price movements. It works particularly well when used across multiple timeframes to confirm trading signals and reduce false positives.
Traders should pay special attention to the indicator when the RSI crosses key threshold levels like 30 or 70, or when the moving averages show convergence or divergence. It is especially useful for identifying potential trend reversals and confirming entry or exit points in various market environments.
Keep exploring
What we’ve verified
Access, alerts and repainting behaviour have not been independently verified for this indicator. Check the creator’s current publication and settings.
General descriptions and classifications are recovered research. Verified details above identify the specific checks we have completed. Check the creator’s current publication for later changes.