Liquidity Swings [LuxAlgo]
A liquidity indicator that highlights swing areas with trading activity, tracking price revisits, accumulated volume, and potential support/resistance zones using customizable filtering.
Explore 11,183 indicators. Filter beyond the obvious.
Discover the tools that fit the way you trade.
11,183 tools to explore
A liquidity indicator that highlights swing areas with trading activity, tracking price revisits, accumulated volume, and potential support/resistance zones using customizable filtering.
A dynamic technical analysis tool that visualizes market trends using adaptive radius-based bands that adjust to price action and volatility, providing insights into trend direction and strength.
A specialized RSI indicator using Kernel Density Estimation to predict potential pivot points by analyzing historical RSI patterns and calculating probability of price reversals.
A generalized Gaussian filter that smooths price data with variable pole orders, reducing noise and high-frequency market movements using advanced signal processing techniques.
A tool that identifies potential price reversal zones using statistical probability by analyzing historical swing points and calculating precise percentile-based predictions.
A trading tool highlighting specific time-based market zones and Fibonacci retracements to identify optimal entry points across different forex trading sessions.
A machine learning-enhanced momentum oscillator that analyzes market trends using weighted moving averages and k-Nearest Neighbors algorithm for dynamic and adaptive momentum prediction.
A sophisticated momentum oscillator using windowed sinc low pass filter to generate smoother, more accurate rate of change analysis with advanced visualization features.
Advanced volume profile indicator offering high-resolution analysis of trading volume across multiple range modes, providing traders with detailed insights into market structure and price-volume relationships.
A Market Profile indicator that visualizes price and volume distribution, highlighting key trading levels and providing insights into market structure through time-price opportunity (TPO) analysis.
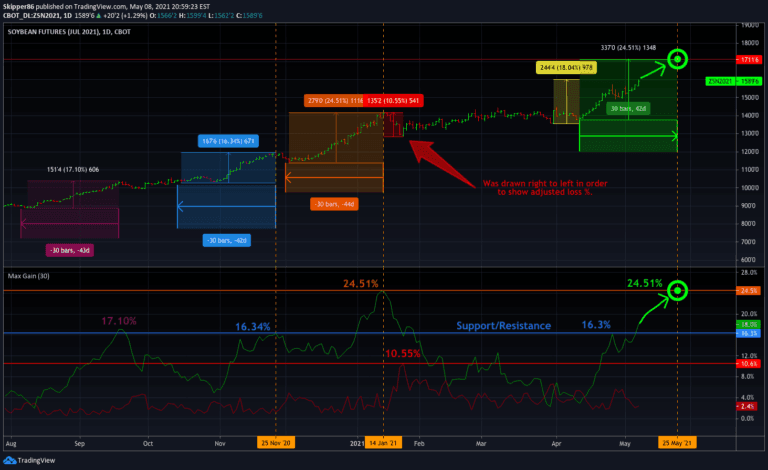
A trading indicator that calculates potential price targets by analyzing percentage gains and losses over a specified time period, helping traders identify potential resistance levels and performance targets.
A trading tool that tracks major economic events and their potential market impact, helping traders understand pivotal moments in financial markets.
Likes, views, and comments are historical TradingView snapshots. They describe attention, not trading performance.