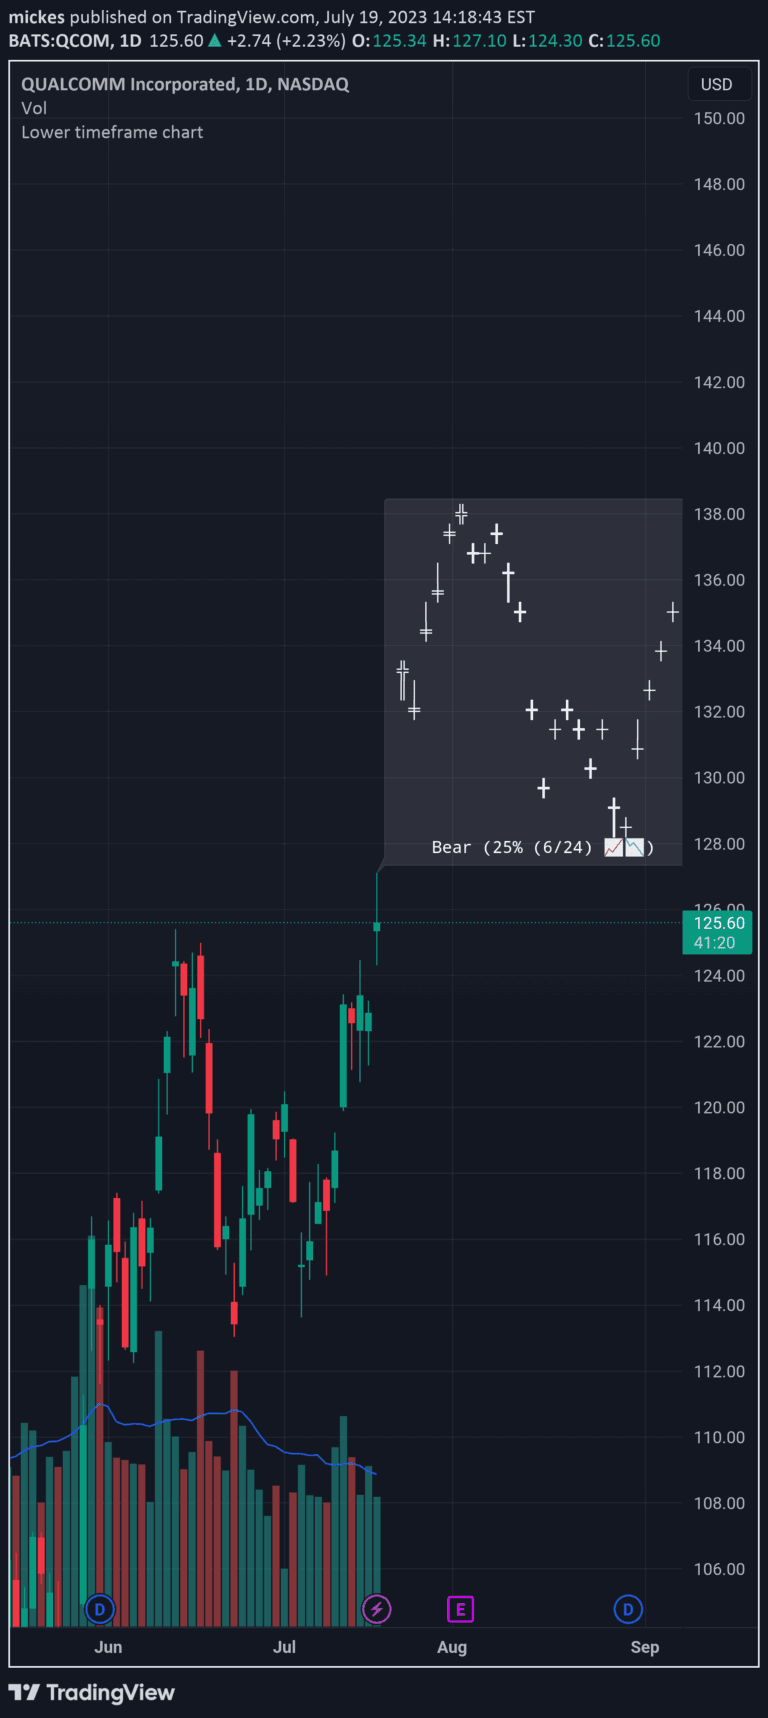
A widget that tracks all-time high and all-time low price levels, providing traders with insights into historical price extremes and potential breakout opportunities.
Explore complementary indicator rolesHow it works
The All-Time High/Low widget monitors and records the highest and lowest price levels reached by an asset throughout its trading history. It continuously updates these levels and calculates the current distance from these extreme points. The widget can plot horizontal lines representing the all-time high and low prices directly on the price chart.
When the price approaches or breaks these levels, the widget triggers visual alerts and notifications. It provides additional statistical information about when these levels were first established and how significant the current price is in relation to these historical extremes
Why it may be useful
The All-Time High/Low widget helps traders understand an asset's historical price performance and psychological price levels. It offers valuable insights into market sentiment and potential trend reversals. By highlighting extreme price points, traders can identify key support and resistance levels that might influence future price movements.
The widget assists in recognizing potential breakout opportunities and assessing an asset's long-term price trajectory. Understanding these historical extremes can help traders make more informed decisions about entry, exit, and risk management strategies
When to explore it
The All-Time High/Low widget is most effective in trending markets with clear directional movements. It works well for assets with stable long-term price histories, such as major stocks, cryptocurrencies, and established commodities. Traders can use this tool during periods of market consolidation or when searching for potential trend reversal points.
It is particularly useful for swing traders and investors who focus on longer-term price patterns. The widget is most valuable when combined with other technical analysis tools to confirm potential trading signals and validate market trends
Keep exploring
What we’ve verified
Access, alerts and repainting behaviour have not been independently verified for this indicator. Check the creator’s current publication and settings.
General descriptions and classifications are recovered research. Verified details above identify the specific checks we have completed. Check the creator’s current publication for later changes.