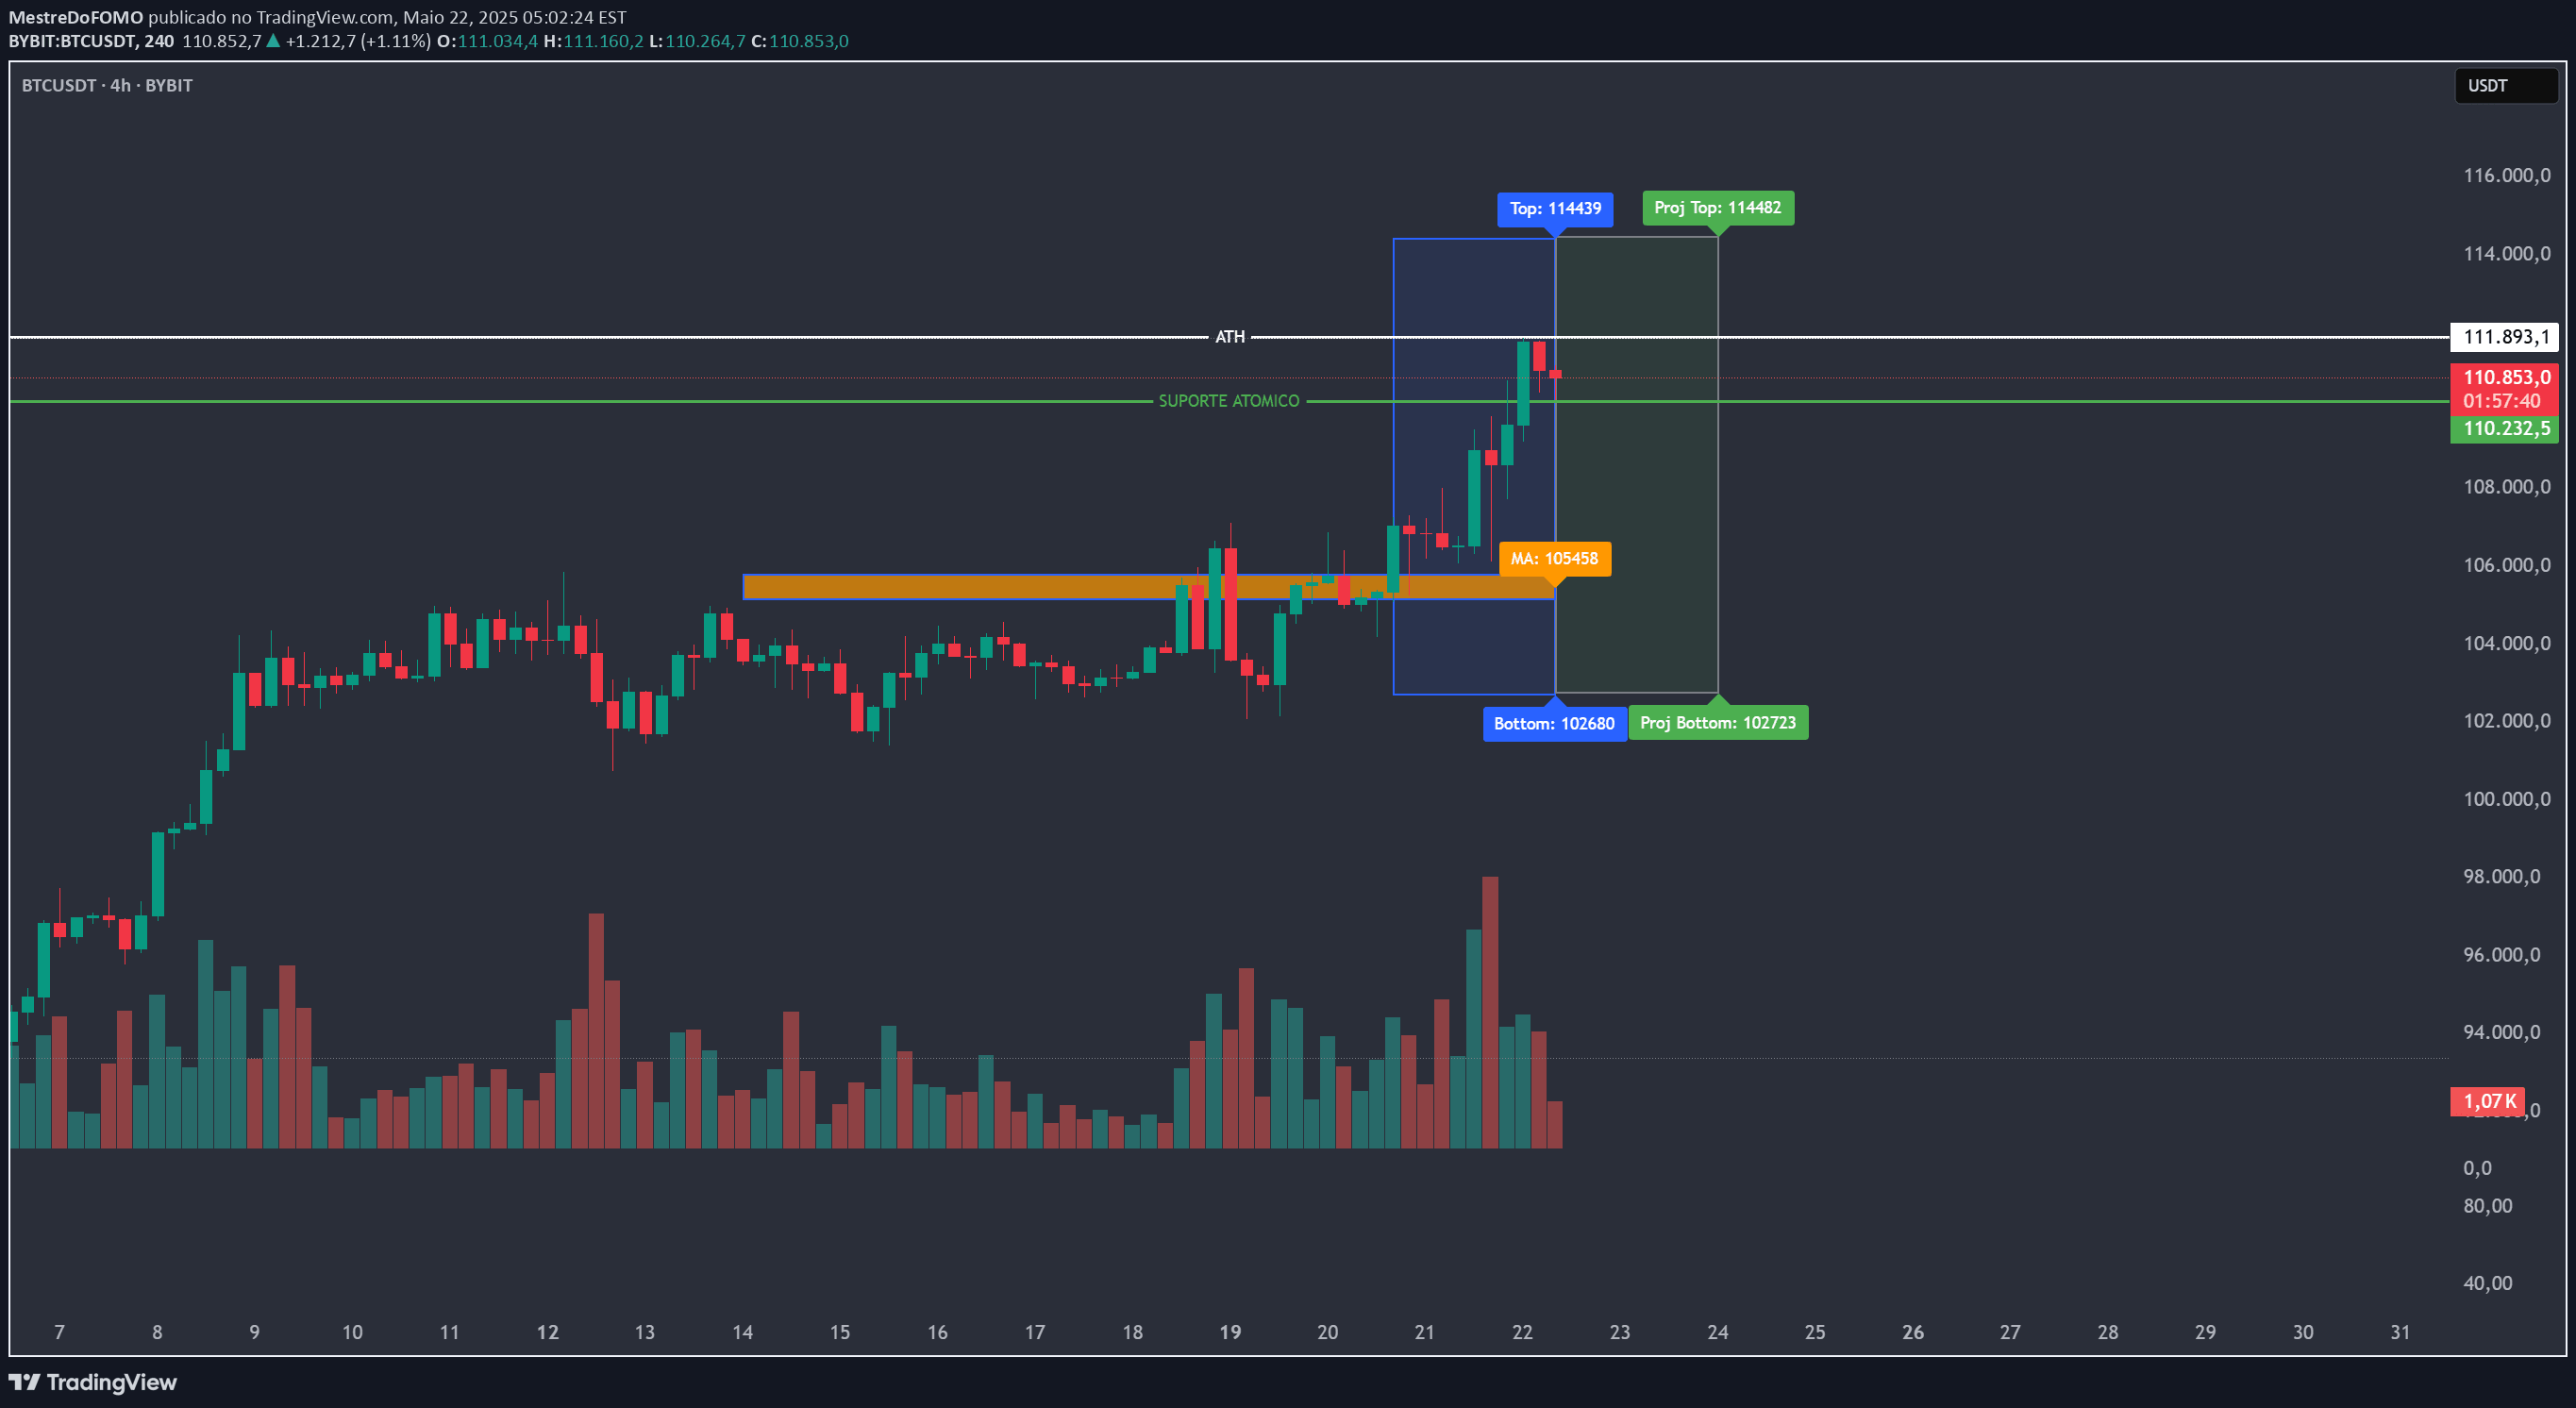
An indicator tracking All-Time High (ATH) and All-Time Low (ATL) changes, providing insights into market sentiment and breadth by analyzing price movements across historical peaks and troughs.
Explore complementary indicator rolesHow it works
The ATH/ATL Tracker filters significant market highs and lows by examining a higher timeframe than the current chart, ensuring only meaningful price movements are captured. It creates a histogram displaying the price changes between new and previous All-Time Highs and All-Time Lows, with each bar representing the magnitude of price movement.
The indicator uses a designated higher timeframe to eliminate insignificant price fluctuations, preventing false signals caused by minor price variations. By comparing current ATHs/ATLs with historical values, the tracker provides a comprehensive view of price progression and market momentum across different time periods.
Why it may be useful
The ATH/ATL Tracker offers traders valuable insights into market sentiment, helping them understand the broader market dynamics and sector performance. By revealing which stocks and sectors are consistently setting new highs, traders can identify strong market trends and potential leadership sectors.
This indicator helps traders gauge investor confidence and market breadth by showing how many stocks are participating in a rally. A consistent increase in new ATHs suggests optimism and positive market sentiment, while a decline might indicate potential market hesitation or rotation.
When to explore it
The ATH/ATL Tracker is most effective during trending markets, particularly when analyzing sector rotations and identifying emerging market leaders. Traders can utilize this indicator during periods of significant market movement to understand which sectors are outperforming and showing strong momentum.
It is particularly useful for swing traders and investors seeking to understand long-term market trends and sector performance. By providing a historical perspective on price movements, the indicator helps traders make more informed decisions about potential entry and exit points across different market segments.
Keep exploring
What we’ve verified
Access, alerts and repainting behaviour have not been independently verified for this indicator. Check the creator’s current publication and settings.
General descriptions and classifications are recovered research. Verified details above identify the specific checks we have completed. Check the creator’s current publication for later changes.