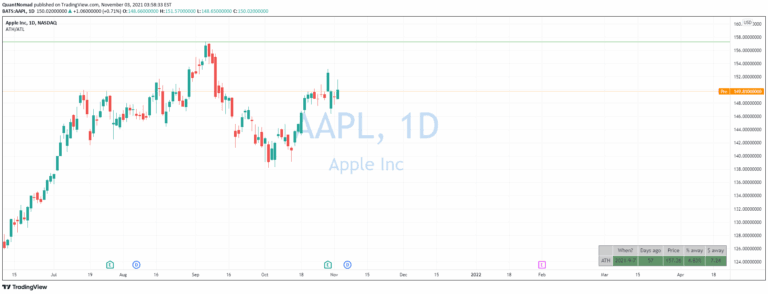
All Time High (ATH) Levels [LuxAlgo]
An indicator that tracks historical all-time high levels, helping traders identify potential support and resistance zones based on past price peaks.
Explore 11,183 indicators. Filter beyond the obvious.
Discover the tools that fit the way you trade.
11,183 tools to explore
An indicator that tracks historical all-time high levels, helping traders identify potential support and resistance zones based on past price peaks.
A widget that tracks all-time high and all-time low price levels, providing traders with insights into historical price extremes and potential breakout opportunities.
An indicator tracking All-Time High (ATH) and All-Time Low (ATL) changes, providing insights into market sentiment and breadth by analyzing price movements across historical peaks and troughs.
A visual heatmap tool that tracks asset performance by displaying the percentage distance from their All-Time High prices, helping traders quickly assess market trends and potential opportunities.
A trading tool that calculates and visualizes the relationship between Dollar Cost Average (DCA) prices and All-Time High (ATH) prices for cryptocurrencies, helping traders assess investment performance.
Likes, views, and comments are historical TradingView snapshots. They describe attention, not trading performance.