YOUR INDICATOR RESEARCH STARTS HERE

Find the right indicator.
Understand what it does.

Explore 11,183 indicators. Filter beyond the obvious.
Discover the tools that fit the way you trade.

THE INDICATOR LIBRARY

Results for “masterpattern”

11,183 tools to explore

7 indicators matching your filters
Save search
LevelsPatternsSignal

Master Pattern [LuxAlgo]

by LuxAlgo

A trading indicator that detects market contraction phases, identifies major and minor patterns, and highlights potential expansion and markup zones through dynamic lines and levels.

Main price chart · unverifiedScalping · Day Trading
Explore
4.6Klikes141.6Kviews20comments
Save
SignalTrend

GRIDBOT Scalper by nnam

by nnamdert

A price action-based indicator designed for GridBots that identifies potential market reversals after sustained price movements, helping traders recognize entry points for short or long trades.

Main price chart · unverifiedScalping · Day Trading
Explore
1.5Klikes30.3Kviews26comments
Save
LevelsSignalTrend

TrendLine Cross

by AleSaira

A trend line indicator that plots multiple support and resistance lines to identify potential market reversals and crossover trading opportunities across different timeframes.

Main price chart · unverifiedScalping · Day Trading
Explore
565likes14.4Kviews24comments
Save
SignalLevelsPatterns

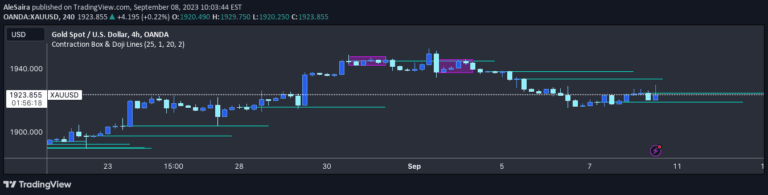
Contraction Box & Doji Lines

by AleSaira

A technical indicator that identifies doji candlestick patterns and price contraction zones, highlighting potential support and resistance levels to help traders anticipate market movements.

Main price chart · unverifiedScalping · Day Trading
Explore
440likes11.4Kviews6comments
Save
VolatilitySignalLevels

Encapsulation Box

by AleSaira

An indicator that identifies market contraction by detecting embedded candlesticks and drawing a rectangle highlighting potential price movement zones with a critical midline.

Main price chart · unverifiedScalping · Day Trading
Explore
238likes4.5Kviews3comments
Save
SignalTrend

Hull Waves

by AleSaira

Hull Waves indicator uses Hull Moving Averages to identify market trends and potential entry/exit points by analyzing price movements through dynamic visual lines and moving average crossovers.

Main price chart · unverifiedScalping · Day Trading
Explore
176likes4.6Kviews3comments
Save
SignalVolatility

Expansion Finder by nnam

by nnamdert

A trading indicator that identifies market contraction and expansion phases by analyzing bar ranges and color-coding bars to help traders recognize trading opportunities.

Main price chart · unverifiedScalping · Day Trading
Explore
148likes4.6Kviews1comments
Save

Likes, views, and comments are historical TradingView snapshots. They describe attention, not trading performance.

START WITH A QUESTION

A little less searching.
A lot more understanding.

Tell DeepAlpha what you need. Get an explanation, a shortlist,
and a direct path to the indicators behind it.

Ask DeepAlpha