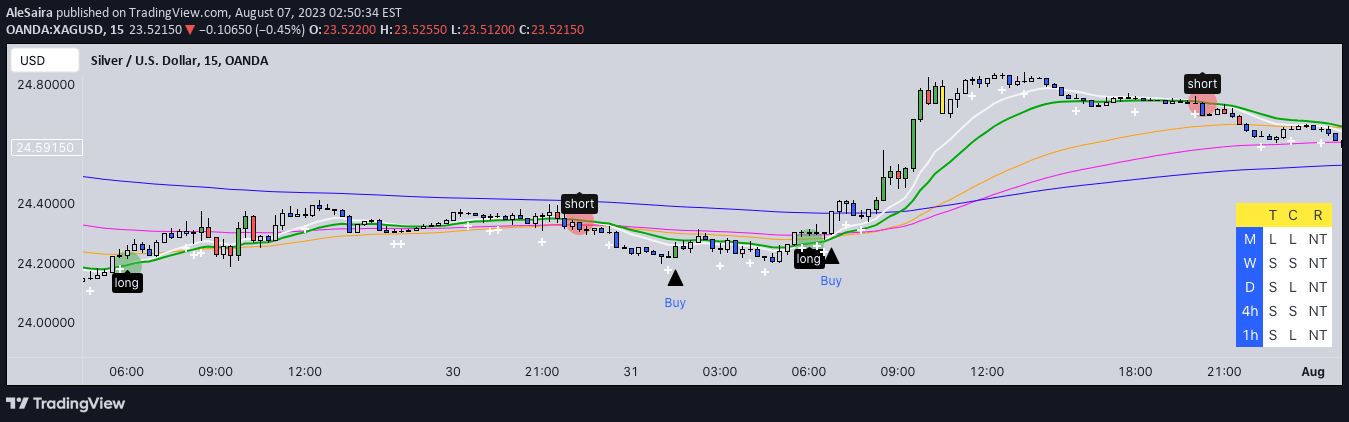
A trading signal using exponential moving averages that generates visual cues through colored triangles and vertical bars to identify potential market entry points and trend directions.
Explore complementary indicator rolesHow it works
The indicator analyzes price movements using multiple exponential moving averages (EMA), specifically the 13, 21, and 200-period EMAs, to generate trading signals. It creates visual markers like colored triangles and vertical bars that represent different market conditions, with specific colors indicating potential buy or sell opportunities.
Green triangles suggest bullish entry points when the 21 EMA crosses above the 200 EMA, while red triangles indicate potential bearish trends when the 21 EMA is below the 200 EMA. White and purple triangles represent moments of market uncertainty or potential trend changes, providing traders with additional context for potential trade entries.
Why it may be useful
This indicator helps traders quickly identify market trends and potential entry points by transforming complex moving average calculations into easy-to-understand visual signals. By using color-coded triangles and vertical bars, traders can rapidly assess market conditions without extensive technical analysis.
The multi-layered approach of tracking different EMA periods allows traders to understand both short-term and long-term market dynamics. The visual representation makes it easier to spot trend changes, potential reversals, and entry opportunities across different timeframes, reducing the cognitive load of traditional technical analysis.
When to explore it
The indicator is most effective in markets with clear trending conditions, where moving averages can provide reliable signals about price direction and momentum. It works particularly well in liquid markets with consistent price movements, such as major currency pairs, stock indices, and large-cap stocks.
Traders should use this signal in conjunction with other technical and fundamental analysis tools to confirm potential trades. It is especially useful for traders who prefer visual trading signals and want a quick, intuitive method of identifying market trends and potential entry points across different trading timeframes.
Keep exploring
What we’ve verified
Access, alerts and repainting behaviour have not been independently verified for this indicator. Check the creator’s current publication and settings.
General descriptions and classifications are recovered research. Verified details above identify the specific checks we have completed. Check the creator’s current publication for later changes.