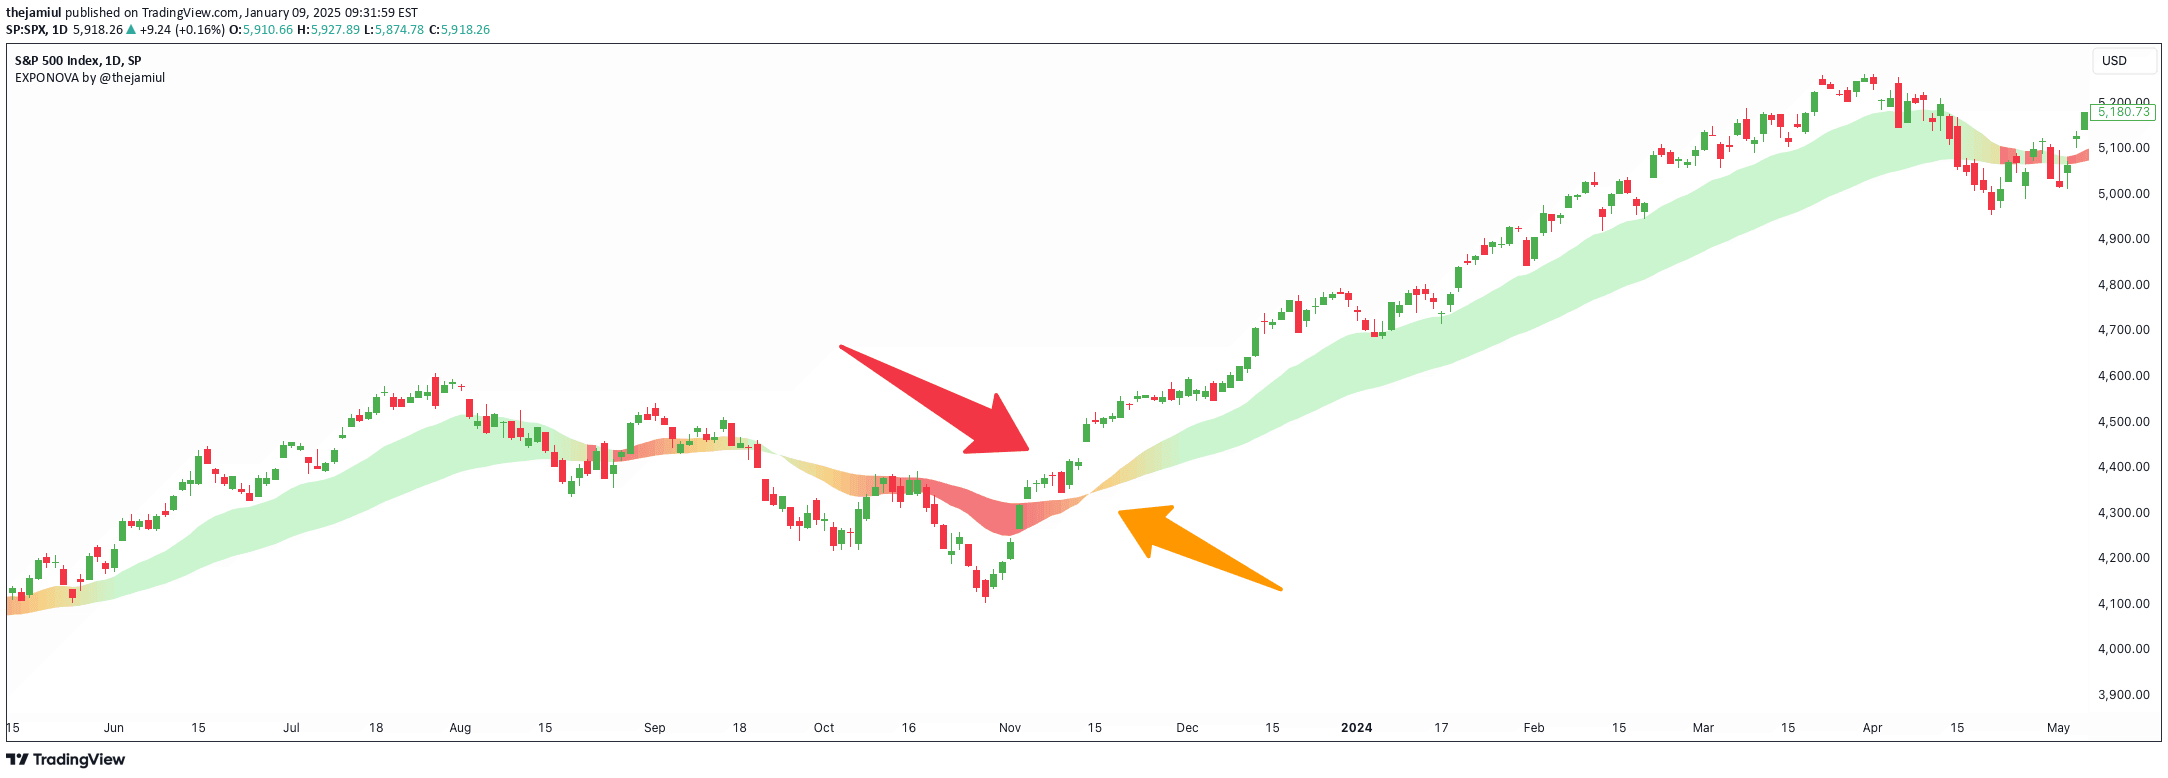
A comprehensive trend analysis tool using five customizable Exponential Moving Averages (EMAs) to provide multi-timeframe insights into market direction and potential trading signals.
Explore complementary indicator rolesHow it works
The Multiple EMA Indicator calculates five Exponential Moving Averages with different lengths, each representing a distinct timeframe and using close price as the default source. These EMAs are color-coded and plotted directly on the price chart, allowing traders to quickly visualize the relationship between different moving averages.
The indicator automatically sets default lengths ranging from short-term (10-period) to long-term (200-period) EMAs, providing a comprehensive view of market trends. Traders can customize each EMA's length and source, enabling flexible analysis across various market conditions and trading styles.
Why it may be useful
The Multiple EMA Indicator offers traders a nuanced approach to understanding market trends by providing multiple perspectives simultaneously. By displaying EMAs of different lengths, traders can gain insights into short-term, medium-term, and long-term price movements, helping them make more informed trading decisions.
This tool is particularly valuable because it helps traders identify trend direction, potential support and resistance levels, and momentum shifts. The visual representation of EMAs allows for quick trend recognition, crossover signals, and assessment of trend strength, making complex market analysis more accessible to traders of all experience levels.
When to explore it
The Multiple EMA Indicator works best in trending markets where price is showing clear directional movement, either bullish or bearish. It is particularly effective when used on timeframes that match the trader's specific trading strategy, whether scalping, day trading, or swing trading. The indicator can help confirm trend changes and provide potential entry and exit points.
Traders should consider using this indicator in conjunction with other technical analysis tools to validate signals and manage risk. It is most reliable when the EMAs show clear alignment and spacing, indicating a strong trend, and can be less effective during periods of market consolidation or high volatility.
Keep exploring
What we’ve verified
Access, alerts and repainting behaviour have not been independently verified for this indicator. Check the creator’s current publication and settings.
General descriptions and classifications are recovered research. Verified details above identify the specific checks we have completed. Check the creator’s current publication for later changes.