
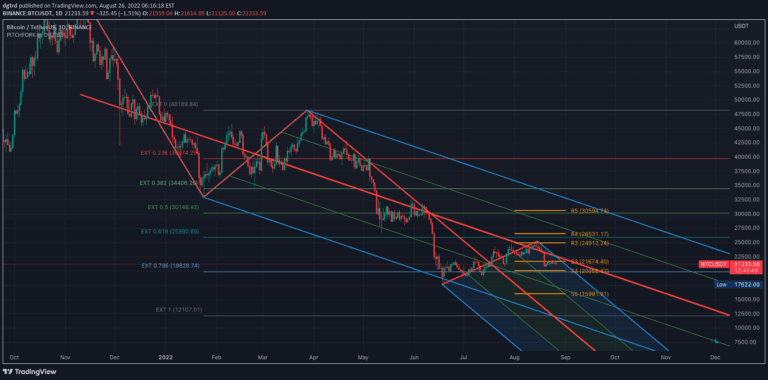
Auto Pitchfork, Fib Retracement and Zig Zag by DGT
Pitchfork is a technical indicator that helps traders identify potential support and resistance levels by drawing trend lines based on three strategic points in price movement.
Explore 11,183 indicators. Filter beyond the obvious.
Discover the tools that fit the way you trade.
11,183 tools to explore
Pitchfork is a technical indicator that helps traders identify potential support and resistance levels by drawing trend lines based on three strategic points in price movement.
SuperBollingerTrend combines Bollinger Bands and SuperTrend to analyze market volatility and trend direction, providing traders insights into potential trend changes and breakouts.
K-means clustering algorithm identifies potential support and resistance levels by grouping similar price data points, offering traders insights into market behavior and potential price reversals.
The Stochastic Momentum Index (SMI) is an advanced oscillator that measures price momentum by calculating the closing price's position relative to the high-low range.
A sophisticated trading indicator that tracks median price proximity using percentile calculations within dynamic standard deviation bands to help traders identify market trends and potential reversals.
A versatile technical indicator using median Kijun-Sen to identify market trends, entry/exit points, and potential overbought or oversold conditions across multiple trading modes.
A dynamic indicator analyzing price deviations from a smoothed midline, providing traders with visual insights into market conditions through deviation levels and heat-colored candles.
An innovative index tracking institutional trading activity by analyzing volume and price range, providing insights into potential market movements without indicating specific direction.
An advanced volume analysis tool for crypto trading that aggregates volume data across multiple exchanges, offering customizable volume calculation and display methods.
A tool that visualizes seasonal price trends across different time granularities, allowing traders to analyze recurring market patterns and potential price movements.
A sophisticated statistical approach using weighted Harrell-Davis quantile estimators to analyze price distributions more accurately than traditional methods, providing robust insights into market behavior.
A multi-timeframe Median Absolute Deviation indicator that identifies market momentum and potential reversal points by analyzing price dispersion from the median across different timeframes.
Likes, views, and comments are historical TradingView snapshots. They describe attention, not trading performance.
