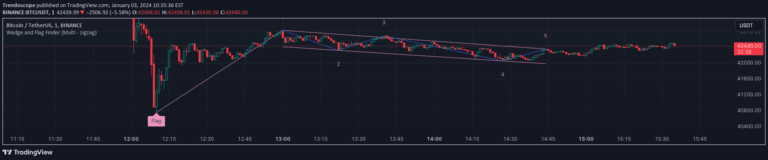
Wedge and Flag Finder (Multi - zigzag)
A refined wedge and flag pattern recognition technique using five pivots instead of the standard four, designed to reduce noise and improve pattern identification in trading signals.
Explore 11,183 indicators. Filter beyond the obvious.
Discover the tools that fit the way you trade.
11,183 tools to explore
A refined wedge and flag pattern recognition technique using five pivots instead of the standard four, designed to reduce noise and improve pattern identification in trading signals.
NR4 & NR7 is a pattern recognition indicator that identifies narrow range candles to detect potential market breakouts and low volatility transitions.
A volatility-based indicator that identifies price contraction periods by analyzing band narrowing and price behavior, signaling potential upcoming market movements.
A precision trading tool for identifying market consolidation zones and generating dynamic breakout signals using volatility or trend strength metrics for strategic entry and exit points.
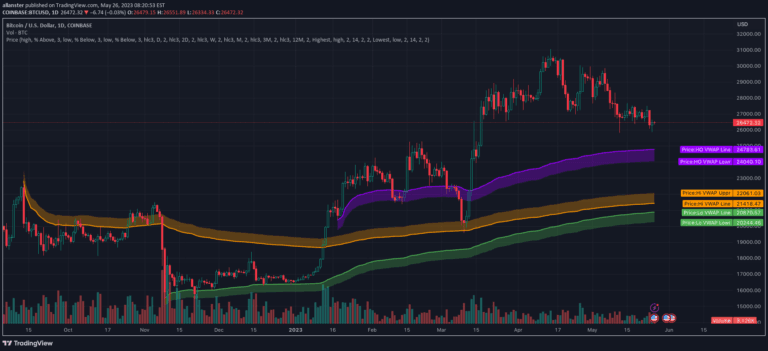
An advanced VWAP toolbox that provides multiple anchored VWAP techniques, including pinch and handoff strategies, periodic intervals, and automatic anchor selection for technical analysis.
A comprehensive indicator analyzing daily price range, volatility compression, and trading opportunities through NR7, WR20, TTM Squeeze, and Average Daily Range metrics.
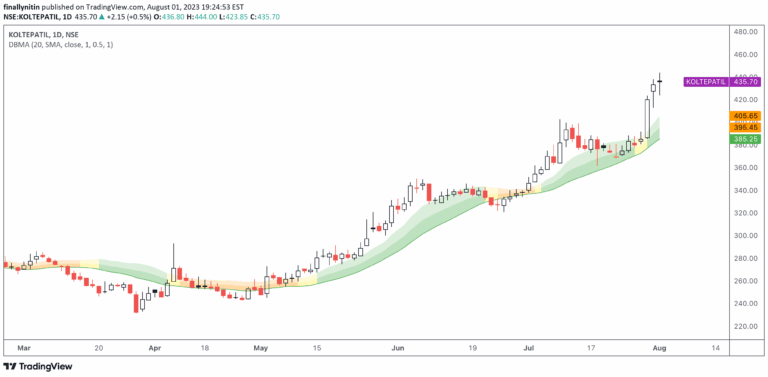
A Dual Bollinger Moving Average (DBMA) indicator that uses moving averages and Bollinger Bands to analyze price compression and potential trading opportunities.
Nunchucks is a unique market data visualization tool that tracks price ranges without changing colors during the current candle. It displays higher and lower ranges compared to previous nunchuck boundaries.
A Pine Script indicator that identifies price consolidation and potential breakouts by analyzing candle ranges, calculating take profit and stop loss levels dynamically.
A trading strategy using Fibonacci extension tool to identify triangle formations and predict potential take profit levels based on specific trend-based price movements.
A volatility compression breakout indicator that identifies low volatility periods and potential market breakouts using Keltner Channels and EMA to signal trend direction and momentum.
A trading script that detects range-bound market conditions and breakout signals by analyzing volatility compression and volume imbalance across different market timeframes.
Likes, views, and comments are historical TradingView snapshots. They describe attention, not trading performance.