
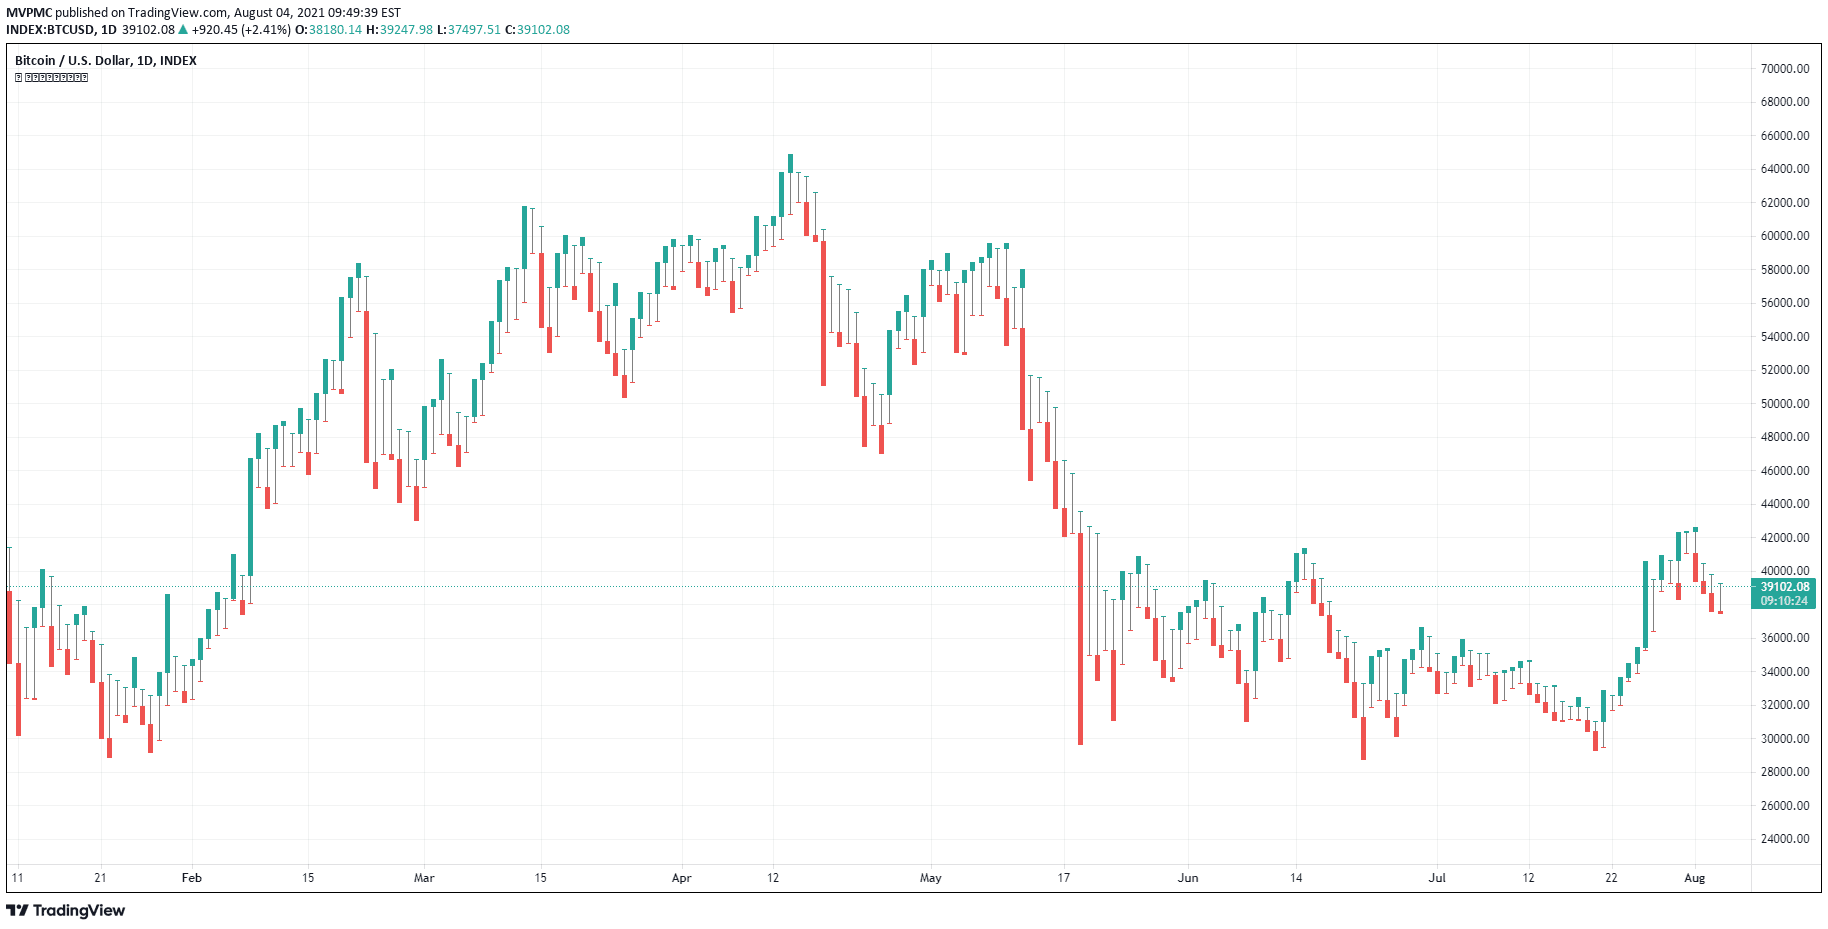
Nunchucks is a unique market data visualization tool that tracks price ranges without changing colors during the current candle. It displays higher and lower ranges compared to previous nunchuck boundaries.
Explore complementary indicator rolesHow it works
The Nunchucks indicator operates by establishing a dynamic range based on previous price movements without changing colors during the current candle. It tracks and displays the market's price boundaries by comparing current price action to the previous nunchuck's range.
The indicator provides a visual representation of market movement without disrupting the current candle's color scheme. Traders can observe potential high and low points within the established range. The tool helps identify potential price expansion or compression zones. By maintaining consistent visual representation, it allows for smoother market analysis
Why it may be useful
The Nunchucks indicator offers traders a unique perspective on market price movements by providing a stable and consistent visual representation. It helps traders understand price dynamics without the distraction of constantly changing color schemes. The indicator can reveal potential market trends and range expansions more clearly.
Traders can use this tool to make more informed decisions about market entry and exit points. It provides a different approach to market analysis compared to traditional indicators. The visualization can help traders identify potential price patterns more intuitively. This approach can enhance overall market understanding and strategic decision-making
When to explore it
The Nunchucks indicator works best in markets with moderate to high volatility and clear price trends. It is particularly useful during day trading and swing trading scenarios where price range identification is crucial. Traders should apply this indicator when seeking a different perspective on market movements.
It can be especially helpful in markets like forex, stocks, and cryptocurrencies. The tool is most effective when combined with other technical analysis methods. Traders should use it to complement their existing trading strategies and not rely on it exclusively. Understanding the indicator's nuances and practicing its interpretation is key to successful implementation
Keep exploring
What we’ve verified
Access, alerts and repainting behaviour have not been independently verified for this indicator. Check the creator’s current publication and settings.
General descriptions and classifications are recovered research. Verified details above identify the specific checks we have completed. Check the creator’s current publication for later changes.



