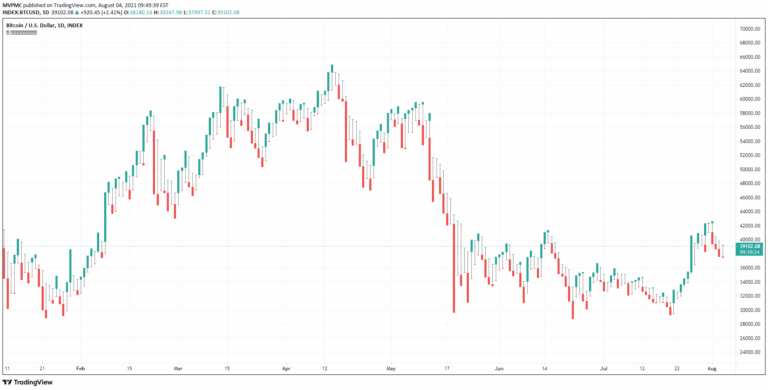
Line Break Chart Strategy
Line Break Chart Strategy is a Japanese chart style focusing on price movements without time intervals. It creates dynamic trend visualization through up and down lines based on price breaks.
Explore 11,183 indicators. Filter beyond the obvious.
Discover the tools that fit the way you trade.
11,183 tools to explore
Line Break Chart Strategy is a Japanese chart style focusing on price movements without time intervals. It creates dynamic trend visualization through up and down lines based on price breaks.
Nunchucks is a unique market data visualization tool that tracks price ranges without changing colors during the current candle. It displays higher and lower ranges compared to previous nunchuck boundaries.
Simple Trendlines is a Pine Script library that helps traders easily draw and manage trendlines with automatic slope calculation and built-in strict mode for precise line drawing.
The LineBreak Indicator is a technical tool that identifies potential trend reversals using unique Line Break chart patterns, generating buy and sell signals based on price movements.
Likes, views, and comments are historical TradingView snapshots. They describe attention, not trading performance.