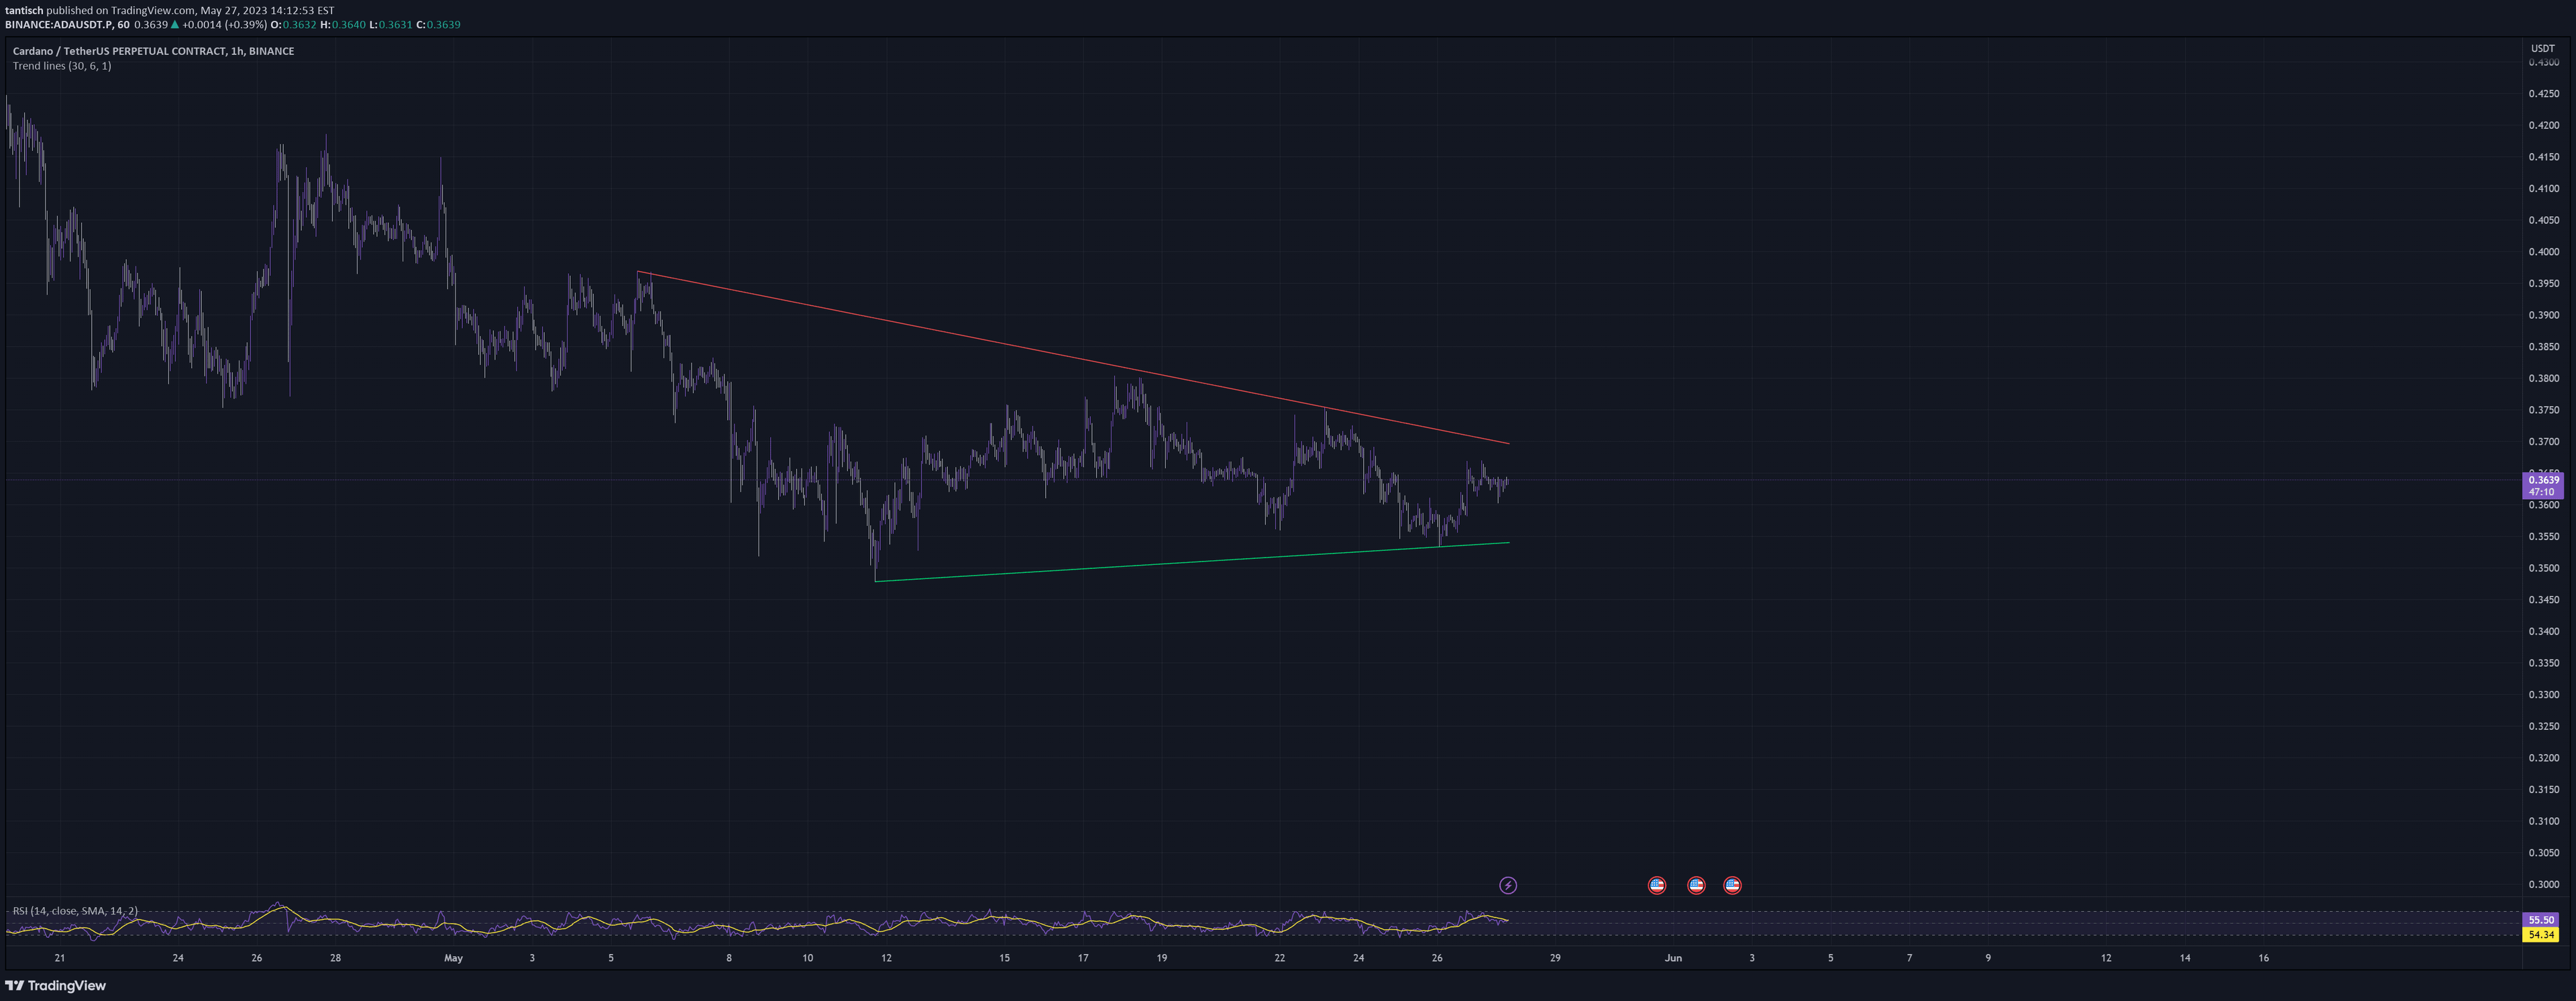
The LineBreak Indicator is a technical tool that identifies potential trend reversals using unique Line Break chart patterns, generating buy and sell signals based on price movements.
Explore complementary indicator rolesHow it works
The LineBreak Indicator creates a specialized chart overlay that focuses exclusively on price movements, eliminating time-based constraints. It generates brick patterns based on a specified size, typically three price units, which form the basis for signal generation.
The indicator analyzes consecutive brick patterns, comparing their open, high, low, and close prices to determine potential trend changes. When specific conditions are met, such as a shift in brick color or price direction, the indicator triggers buy or sell signals, providing traders with insights into potential market momentum shifts.
Why it may be useful
The LineBreak Indicator offers traders a unique perspective on price dynamics by simplifying complex market movements into clear, visually interpretable brick patterns. By focusing on pure price action, it helps traders cut through market noise and identify potential trend reversals more effectively than traditional time-based charting methods.
This approach provides a more intuitive way to understand market sentiment, allowing traders to make more informed decisions about entry and exit points. The indicator's ability to generate timely buy and sell signals can help traders capitalize on emerging trends and potentially improve their overall trading strategy.
When to explore it
The LineBreak Indicator is most effective in markets with clear trending characteristics, such as stocks, forex, and cryptocurrencies that demonstrate consistent directional movements. It works particularly well in markets with moderate to high volatility, where price movements are more pronounced and trend changes are more likely to occur.
Traders should use this indicator in conjunction with other technical analysis tools to confirm signals and validate potential trade opportunities. It is especially useful for traders seeking a more dynamic and price-action-focused approach to market analysis, providing insights that traditional time-based charts might miss.
Keep exploring
What we’ve verified
Access, alerts and repainting behaviour have not been independently verified for this indicator. Check the creator’s current publication and settings.
General descriptions and classifications are recovered research. Verified details above identify the specific checks we have completed. Check the creator’s current publication for later changes.