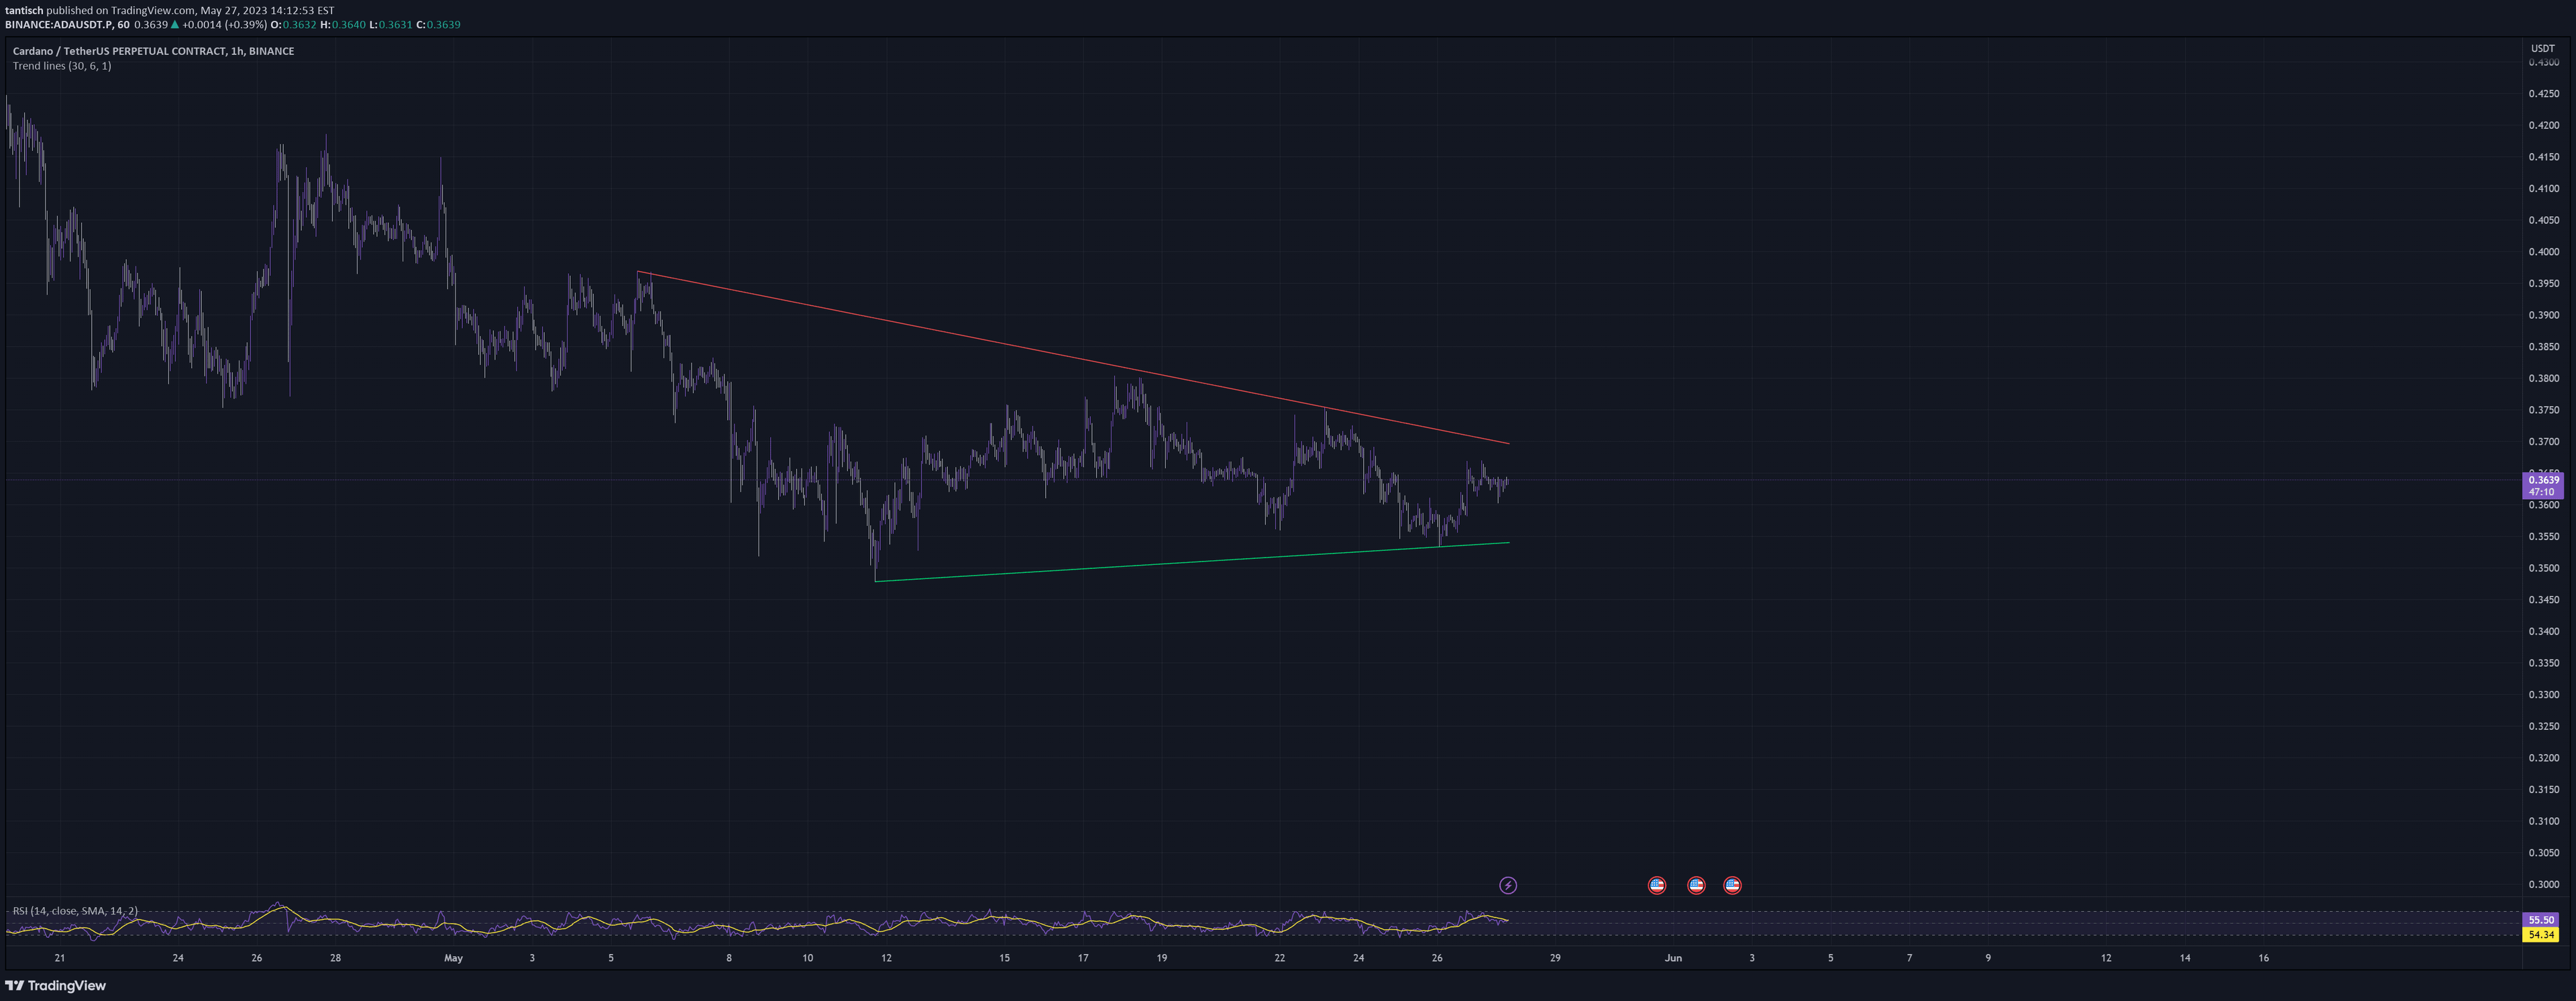
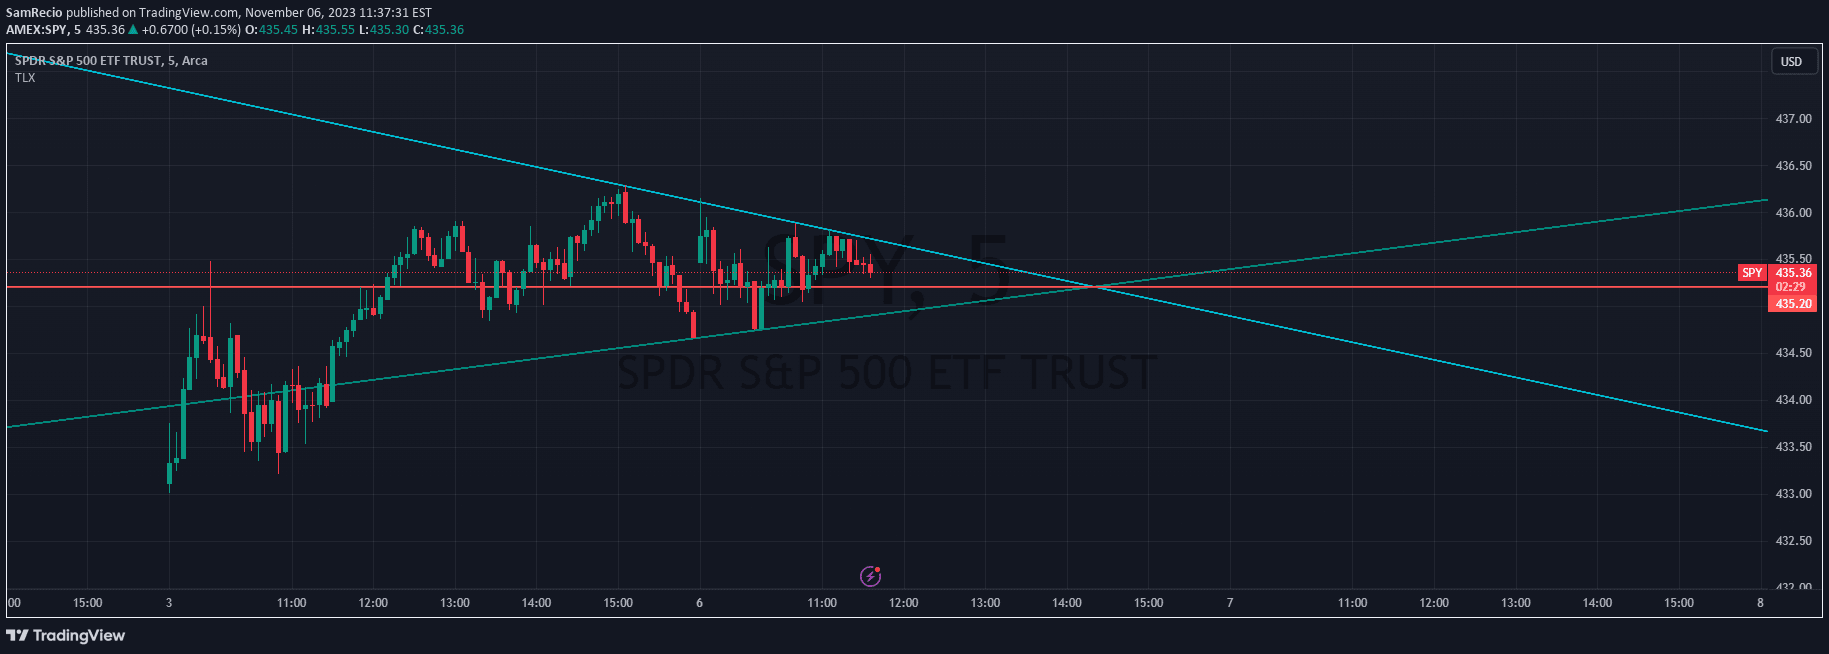
A comprehensive trend indicator using multiple moving average types across three timeframes to help traders identify market direction and potential trading opportunities with enhanced visual clarity.
Explore complementary indicator rolesHow it works
The GL Line Indicator calculates market trends by utilizing different moving average types like EMA, SMA, and VWMA. Traders select fast and slow moving average lengths and apply an ATR multiplier to determine trend direction across primary, secondary, and tertiary timeframes.
The indicator plots these moving averages and fills the space between them with color-coded signals. Green indicates bullish trends, while red represents bearish trends, providing a visual representation of market momentum and potential trade opportunities.
Why it may be useful
By combining multiple moving average types and timeframes, this indicator offers traders a more comprehensive market analysis tool. It helps traders identify trend strength, direction, and potential entry or exit points across different market conditions, reducing the risk of making decisions based on limited information.
The visual color-coding and confluence table make it easier for traders to quickly interpret complex market data. This approach allows for more informed trading decisions by providing a multi-dimensional view of market trends and potential trading signals.
When to explore it
The GL Line Indicator is most effective when used on higher timeframes with secondary and tertiary trends set to longer periods than the current chart. This approach provides a broader market perspective and increases the reliability of trend signals.
Traders should use this indicator when seeking a comprehensive trend analysis tool that offers flexibility in moving average selection and timeframe analysis. It is particularly useful for traders who want to combine multiple trend-detection methods and gain a more nuanced understanding of market dynamics.
Keep exploring
What we’ve verified
Access, alerts and repainting behaviour have not been independently verified for this indicator. Check the creator’s current publication and settings.
General descriptions and classifications are recovered research. Verified details above identify the specific checks we have completed. Check the creator’s current publication for later changes.