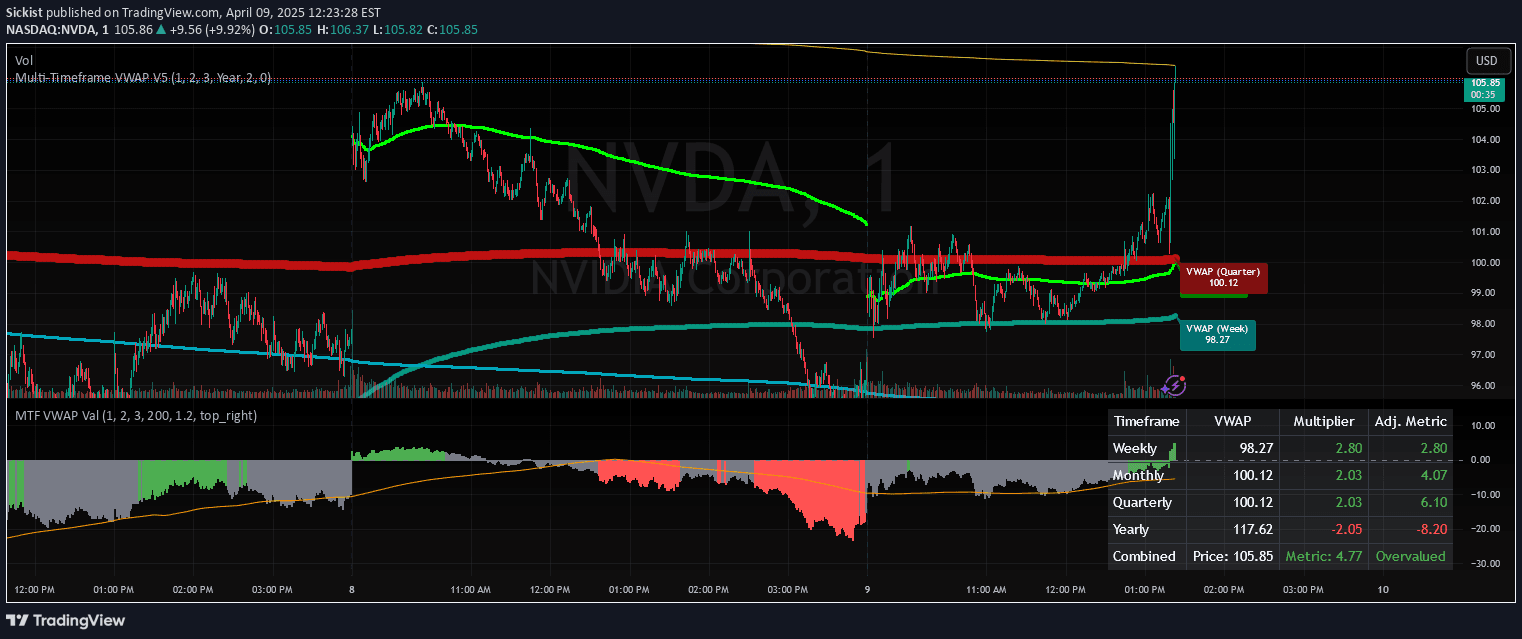
A hybrid Hull Moving Average (HMA) indicator that combines 15-minute and 4-hour timeframes to provide a comprehensive trend analysis across different market periods.
Explore complementary indicator rolesHow it works
The indicator calculates Hull Moving Averages (HMAs) on two distinct timeframes: a 15-minute chart and a 4-hour chart. By utilizing the request.security() function, it fetches and plots HMAs from different timeframes, allowing traders to see multiple trend perspectives simultaneously. The script generates three HMAs for the 15-minute timeframe, with the third HMA (ma3) being the primary plotted line.
The 4-hour HMA is calculated using the same period as the longest 15-minute HMA, providing a broader market perspective. This multi-timeframe approach helps traders identify trends across different time horizons, potentially offering more robust trend confirmation and reducing false signals.
Why it may be useful
Multi-timeframe analysis is crucial for traders seeking a comprehensive market view, as it helps validate trends and improve trading decisions. By combining short-term and medium-term trend indicators, traders can gain insights into both immediate price movements and broader market dynamics. This approach reduces the likelihood of making trades based on isolated, potentially misleading signals.
The HMA's adaptive nature allows it to respond more quickly to price changes compared to traditional moving averages, making it a valuable tool for traders across different trading styles. The ability to visualize trends across 15-minute and 4-hour timeframes provides a more nuanced understanding of market momentum and potential trend reversals.
When to explore it
This indicator is most effective in markets with clear trending characteristics, such as forex, stocks, and cryptocurrencies. Traders should apply it during periods of consistent price movement, where trends are more likely to develop and persist. It works best in liquid markets with sufficient trading volume, which helps ensure more reliable trend signals.
Ideal usage includes identifying trend direction, confirming entry and exit points, and providing a multi-timeframe perspective on market movements. Traders should be cautious during periods of high market volatility or during news events, as these can cause rapid price fluctuations that might temporarily disrupt the indicator's effectiveness.
Keep exploring
What we’ve verified
Access, alerts and repainting behaviour have not been independently verified for this indicator. Check the creator’s current publication and settings.
General descriptions and classifications are recovered research. Verified details above identify the specific checks we have completed. Check the creator’s current publication for later changes.