Reversal Signals [LuxAlgo]
A technical analysis tool that identifies potential trend reversals by tracking momentum and trend exhaustion phases across bullish, bearish, and ranging markets.
Explore 11,183 indicators. Filter beyond the obvious.
Discover the tools that fit the way you trade.
11,183 tools to explore
A technical analysis tool that identifies potential trend reversals by tracking momentum and trend exhaustion phases across bullish, bearish, and ranging markets.
The 2B reversal pattern identifies potential market trend reversals by detecting false breakouts and price rebounds, signaling opportune entry points for traders.
Double Tap is a pattern recognition strategy that identifies double top and double bottom formations, providing entry signals based on price action reversals and breakout patterns.
A comprehensive divergence analysis tool that calculates divergence strength across multiple indicators, providing a single metric to assess potential market reversals and trend shifts.
A dynamic tool that analyzes potential liquidation points in trading, measuring market momentum, identifying trader positioning, and highlighting potential reversal zones.
A volume-based trading tool that identifies market imbalances by analyzing premium and discount zones, calculating delta volume to reveal potential price reversals and trend strength.
The Standardized SuperTrend Oscillator transforms the SuperTrend indicator into a dynamic tool for analyzing market trends, offering insights into potential reversals and mean reversion opportunities.
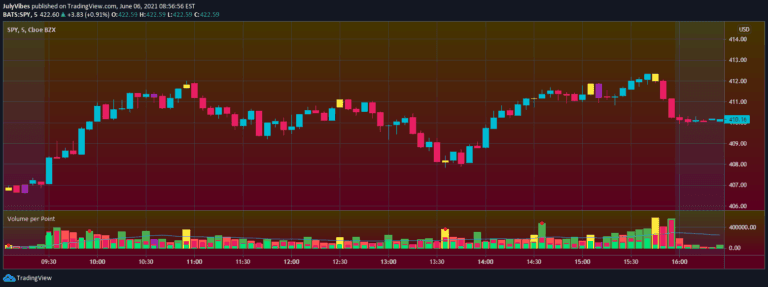
Volume per Point (VP) indicator tracks volume efficiency by analyzing volume relative to price movement, revealing market maker activity and potential trading opportunities through color-coded signals.
A trend reversal probability indicator that uses custom oscillator calculations to estimate market direction shifts and potential trend changes with statistical probability analysis.
The Aroon Oscillator with Mean Reversion is a versatile trading tool that tracks trend strength and potential reversals by measuring price momentum and identifying potential trend changes.
A Wyckoff Springs indicator identifies potential bullish reversal patterns by detecting price dips below support levels followed by quick rebounds, signaling a possible buying opportunity.
A trading strategy focused on identifying and trading significant price gaps in stock markets, exploiting the difference between opening and previous closing prices to generate trading signals.
Likes, views, and comments are historical TradingView snapshots. They describe attention, not trading performance.