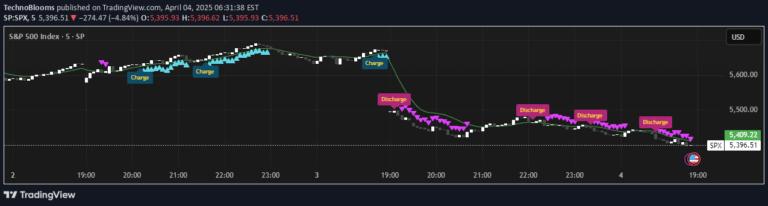
A dynamic technical indicator combining RSI and Stochastic Oscillator to create adaptive bands that measure price momentum and potential reversal zones.
Explore complementary indicator rolesHow it works
The RSI + Stochastic Band Oscillator dynamically creates upper and lower bands using Relative Strength Index and Stochastic Oscillator values. It calculates these bands by analyzing price changes through exponential moving averages and recalculating potential high/low values within a specific lookback window.
The oscillator then normalizes the current price position within these adaptive bands, generating a value between 0 and 100. This normalized value helps traders identify potential market extremes by showing the relative momentum and positioning of the current price against dynamic reference points.
Why it may be useful
Traditional technical indicators often use static thresholds, which can miss nuanced market movements and provide late signals. This adaptive oscillator overcomes those limitations by dynamically adjusting its bands based on recent price action, allowing traders to capture more precise momentum shifts and potential reversal points.
By combining RSI and Stochastic Oscillator techniques, the indicator provides a more comprehensive view of market conditions. Its normalized output and color-coded zones make it easier for traders to quickly interpret market sentiment and identify potential entry or exit opportunities.
When to explore it
The RSI + Stochastic Band Oscillator works best in markets with clear momentum trends and moderate volatility. It is particularly effective in identifying potential trend reversals and assessing the strength of current price movements across different timeframes and asset classes.
Traders should use this indicator in conjunction with other technical analysis tools to confirm signals and reduce false positives. It is especially useful during ranging markets and when looking to understand the underlying momentum behind price action.
Keep exploring
What we’ve verified
Access, alerts and repainting behaviour have not been independently verified for this indicator. Check the creator’s current publication and settings.
General descriptions and classifications are recovered research. Verified details above identify the specific checks we have completed. Check the creator’s current publication for later changes.