
YOUR INDICATOR RESEARCH STARTS HERE

Find the right indicator.
Understand what it does.

Explore 11,183 indicators. Filter beyond the obvious.
Discover the tools that fit the way you trade.

THE INDICATOR LIBRARY

Explore the possibilities

11,183 tools to explore

6 indicators matching your filters
Save search
MomentumVolatilityEditor’s pick

NIG Probability Table

by nasu_is_gaji

A probabilistic trading indicator using Normal-Inverse Gaussian distribution to estimate future price movements by analyzing log returns and calculating real-time return probability distributions.

Separate pane · unverifiedDay Trading · Swing Trading
Explore
457likes16.8Kviews11comments
Save
TrendVolatilityEditor’s pick

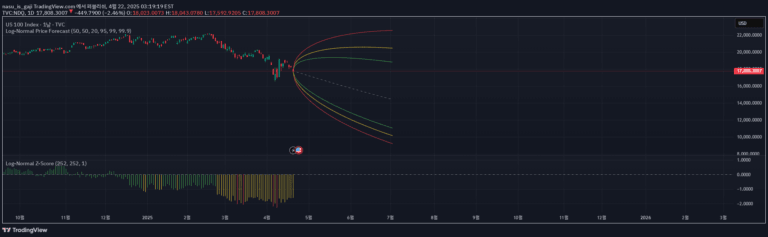
Log-Normal Price Forecast

by nasu_is_gaji

A log-normal price forecast model that predicts future price trajectories using historical log returns, creating statistical projections with confidence intervals and volatility analysis.

Main price chart · unverifiedDay Trading · Swing Trading
Explore
357likes13.1Kviews6comments
Save
MomentumOscillator

RSI+Stoch Band Oscillator

by nasu_is_gaji

A dynamic technical indicator combining RSI and Stochastic Oscillator to create adaptive bands that measure price momentum and potential reversal zones.

Separate pane · unverifiedScalping · Day Trading
Explore
71likes1.1Kviews0comments
Save
MomentumOscillatorTrend

Exponential Regression Log Residual

by nasu_is_gaji

A logarithmic regression indicator that measures price deviation from an exponential trend line, revealing potential overbought and oversold conditions in exponential asset movements.

Separate pane · unverifiedScalping · Day Trading
Explore
21likes484views0comments
Save
SignalTrendVolatility

Log-Normal Z-Score

by nasu_is_gaji

A statistical indicator that calculates modified Z-Scores using log-normal returns to identify significant price deviations and potential market anomalies.

Separate pane · unverifiedScalping · Day Trading
Explore
18likes388views0comments
Save
TrendVolatility

Log-Normal Price Distribution

by nasu_is_gaji

A log-normal distribution model that projects future price ranges by analyzing statistical properties of log returns, helping traders visualize potential price movements and volatility.

Main price chart · unverifiedDay Trading · Swing Trading
Explore
4likes291views0comments
Save

Likes, views, and comments are historical TradingView snapshots. They describe attention, not trading performance.

START WITH A QUESTION

A little less searching.
A lot more understanding.

Tell DeepAlpha what you need. Get an explanation, a shortlist,
and a direct path to the indicators behind it.

Ask DeepAlpha