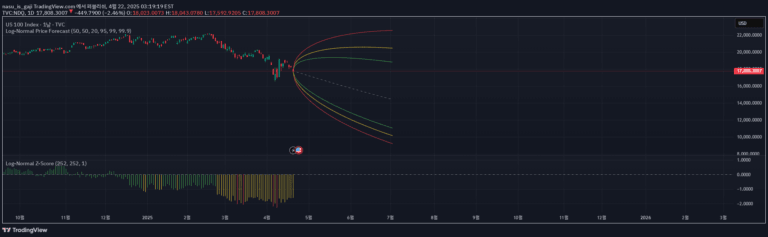
A log-normal distribution model that projects future price ranges by analyzing statistical properties of log returns, helping traders visualize potential price movements and volatility.
Explore complementary indicator rolesHow it works
The log-normal distribution model starts by calculating the mean and standard deviation of log returns over a specified historical period. It transforms these statistical measures into a probabilistic projection of potential future price ranges, utilizing mathematical principles of statistical forecasting.
By applying logarithmic transformations to price data, the indicator creates a symmetrical distribution that represents potential price scenarios. This approach allows traders to understand the statistical likelihood of different price movements, accounting for the inherent randomness and variability in financial markets.
Why it may be useful
This indicator provides traders with a data-driven approach to understanding potential price volatility and range, moving beyond traditional trend analysis. By presenting a statistical model of potential price scenarios, it helps traders make more informed decisions about risk management and potential market movements.
The log-normal distribution model offers a sophisticated method of visualizing market uncertainty, allowing traders to see not just where prices might go, but the probability of different price scenarios. This can be crucial for setting realistic expectations, designing trading strategies, and managing potential risk exposure.
When to explore it
The log-normal distribution model is most effective in markets with relatively consistent historical volatility and when traders want a probabilistic view of potential price ranges. It works best in liquid markets with sufficient historical data to create a robust statistical model.
Traders should use this indicator when they need a comprehensive view of potential price scenarios, particularly during periods of market transition or when preparing for significant economic events. It's particularly useful for options traders, risk managers, and those seeking a more quantitative approach to market analysis.
Keep exploring
What we’ve verified
Access, alerts and repainting behaviour have not been independently verified for this indicator. Check the creator’s current publication and settings.
General descriptions and classifications are recovered research. Verified details above identify the specific checks we have completed. Check the creator’s current publication for later changes.